# Visualizing Kubernetes with Relationship Graphs
> Use relationship graphs to easily navigate your Kubernetes architecture and gain insights to how all the resources are interconnected.
By Steampipe Team
Published: 2023-02-25
To operate Kubernetes you need to know, first, about things like clusters, jobs, namespaces, nodes, pods, roles, and more. But then, and more importantly, you need to understand how they interconnect. K8s experts can and do use `kubectl` commands to explore how it all works. But everyone appreciates when dashboards make it easier.
The [Kubernetes plugin](https://hub.steampipe.io/plugins/turbot/kubernetes), which maps all those things to [tables](https://hub.steampipe.io/plugins/turbot/kubernetes/tables), empowers developers to ask questions of the K8s API using basic SQL. The plugin is a powerful tool in its own right, one you can deploy in many different [Steampipe & Turbot Pipes integrations](https://turbot.com/pipes/docs/connect). It's a solid platform on which to build K8s visualizations like the [Kubernetes Insights Mod](https://hub.steampipe.io/mods/turbot/kubernetes_insights).
All Steampipe Insights mods reflect lessons learned using the systems they describe. That's especially true for K8s Insights because [Turbot Pipes](https://pipes.turbot.com) runs on Kubernetes. As a user of the K8s mod you benefit from that ops experience.
The v0.1 release of K8s Insights used infocards, charts, and tables to represent K8s objects of interest, and interlinked them across dashboards. Building on that foundation, the v0.2 release expands your view with relationship graphs that add context and display interconnections. We'll use Google's [GKE microservices sample](https://github.com/GoogleCloudPlatform/microservices-demo) to explore how these new graphs do that.
## Namespace dashboard
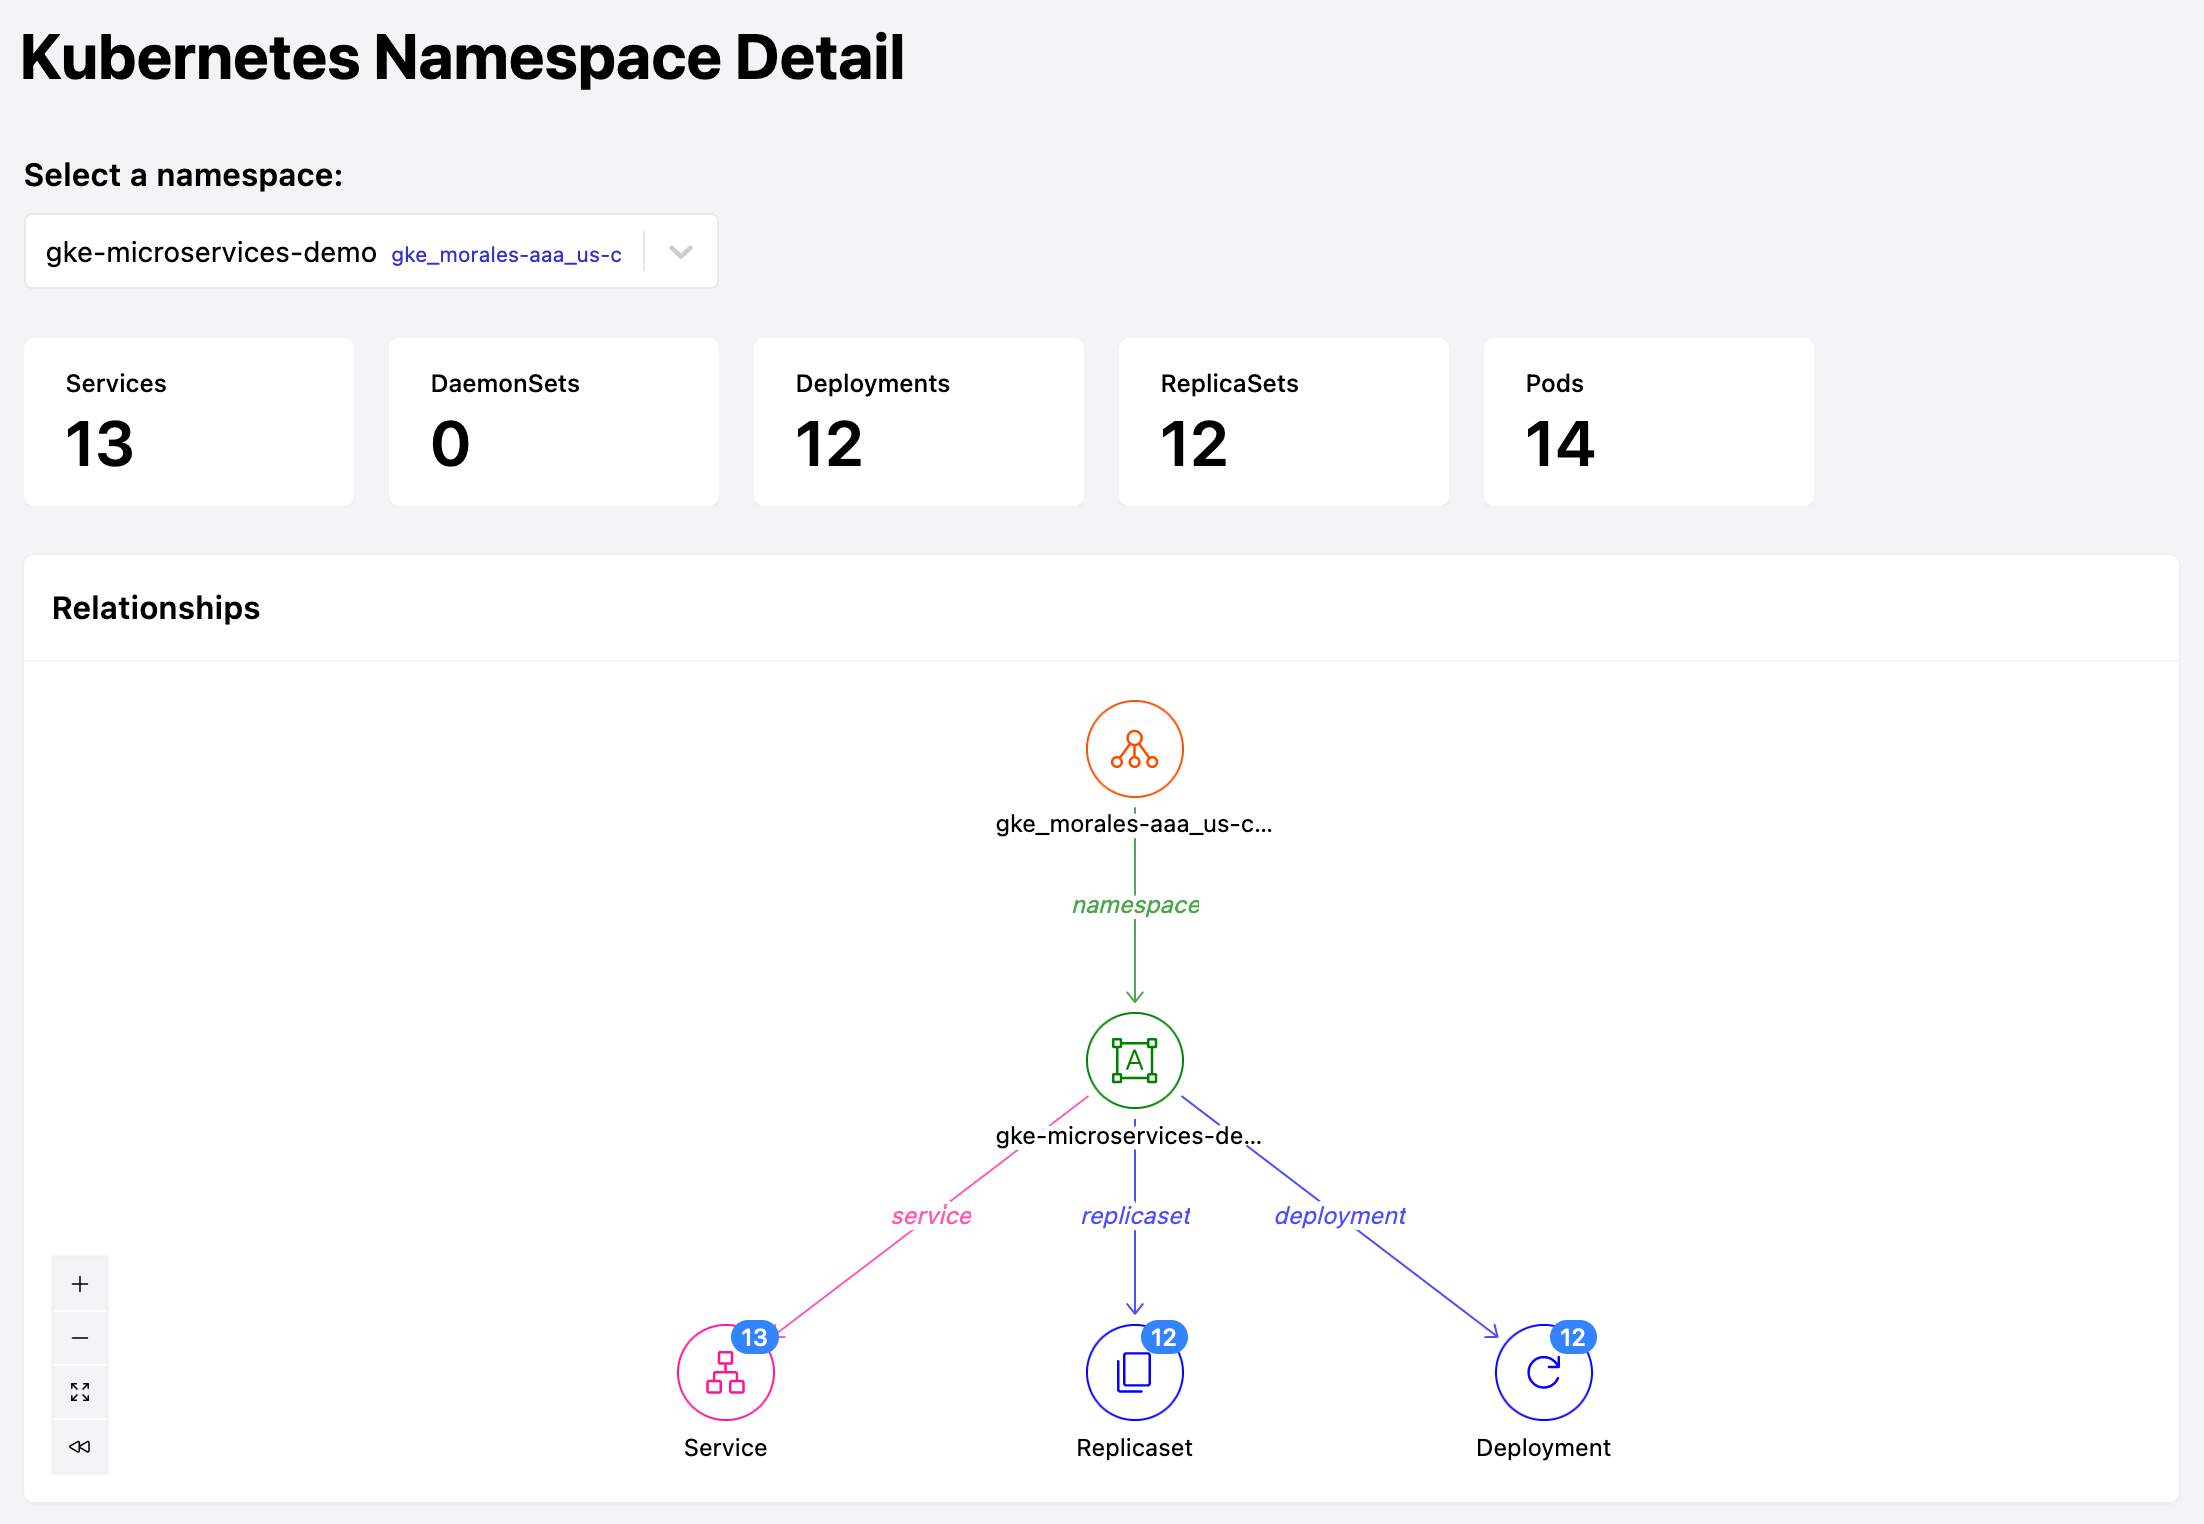
Here's a high-level view of the `gke-microservices-demo` namespace in the [Namespace Detail](https://hub.steampipe.io/mods/turbot/kubernetes_insights/dashboards/dashboard.namespace_detail) dashboard.
The application runs as a suite of 12 Services. On initial view the dashboard folds them all into an individual node, and folds the related ReplicaSets and Deployments into their own individual nodes.
Expanding the *Service* node reveals all 12 Services. Here we're hovering over the `frontend-external` Service which the context popup tells us is a LoadBalancer running on port 80 of the cluster IP address 10.120.10.180.
## Deployment dashboard
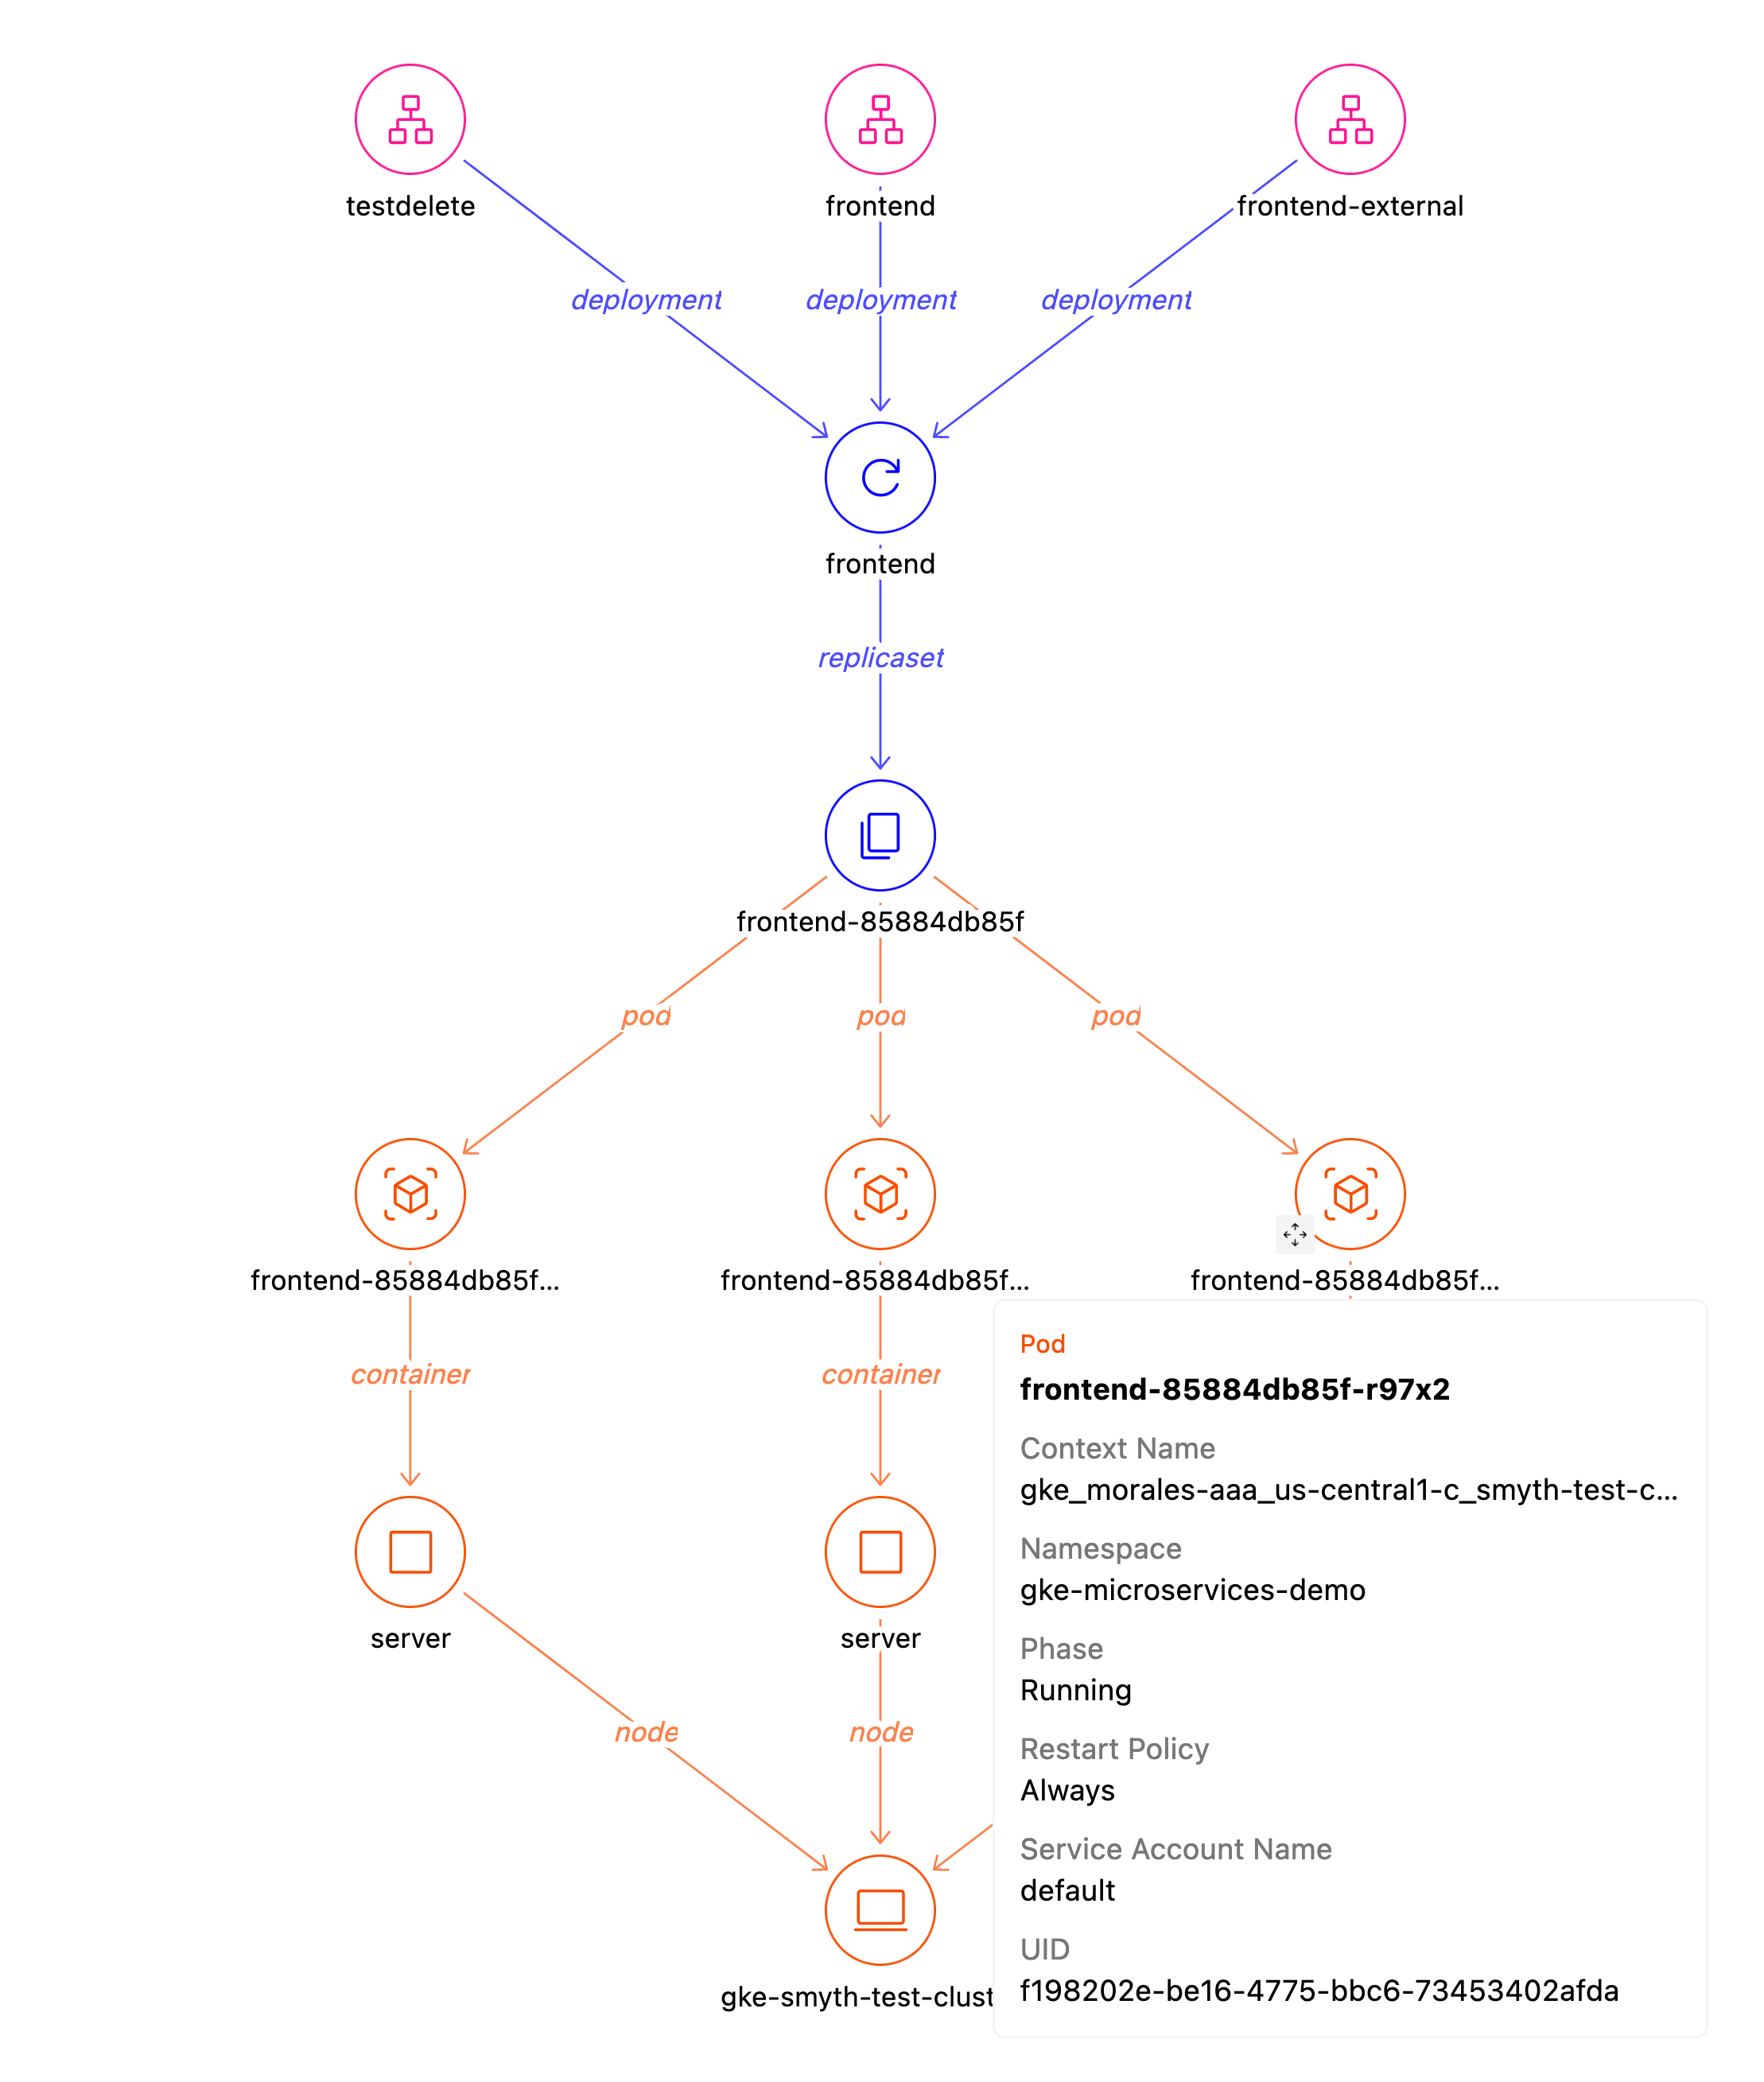
If we open *Deployments* and click on the `frontend` Deployment we land in the [Deployment Detail](https://hub.steampipe.io/mods/turbot/kubernetes_insights/dashboards/dashboard.deployment_detail) dashboard where we see that the `frontend-external` Service shares that Deployment with two other Services, `frontend` and `testdelete`. On hover we see details for one of the 3 pods in that Deployment's ReplicaSet: it's running, and it uses the default service account.
## Service dashboard
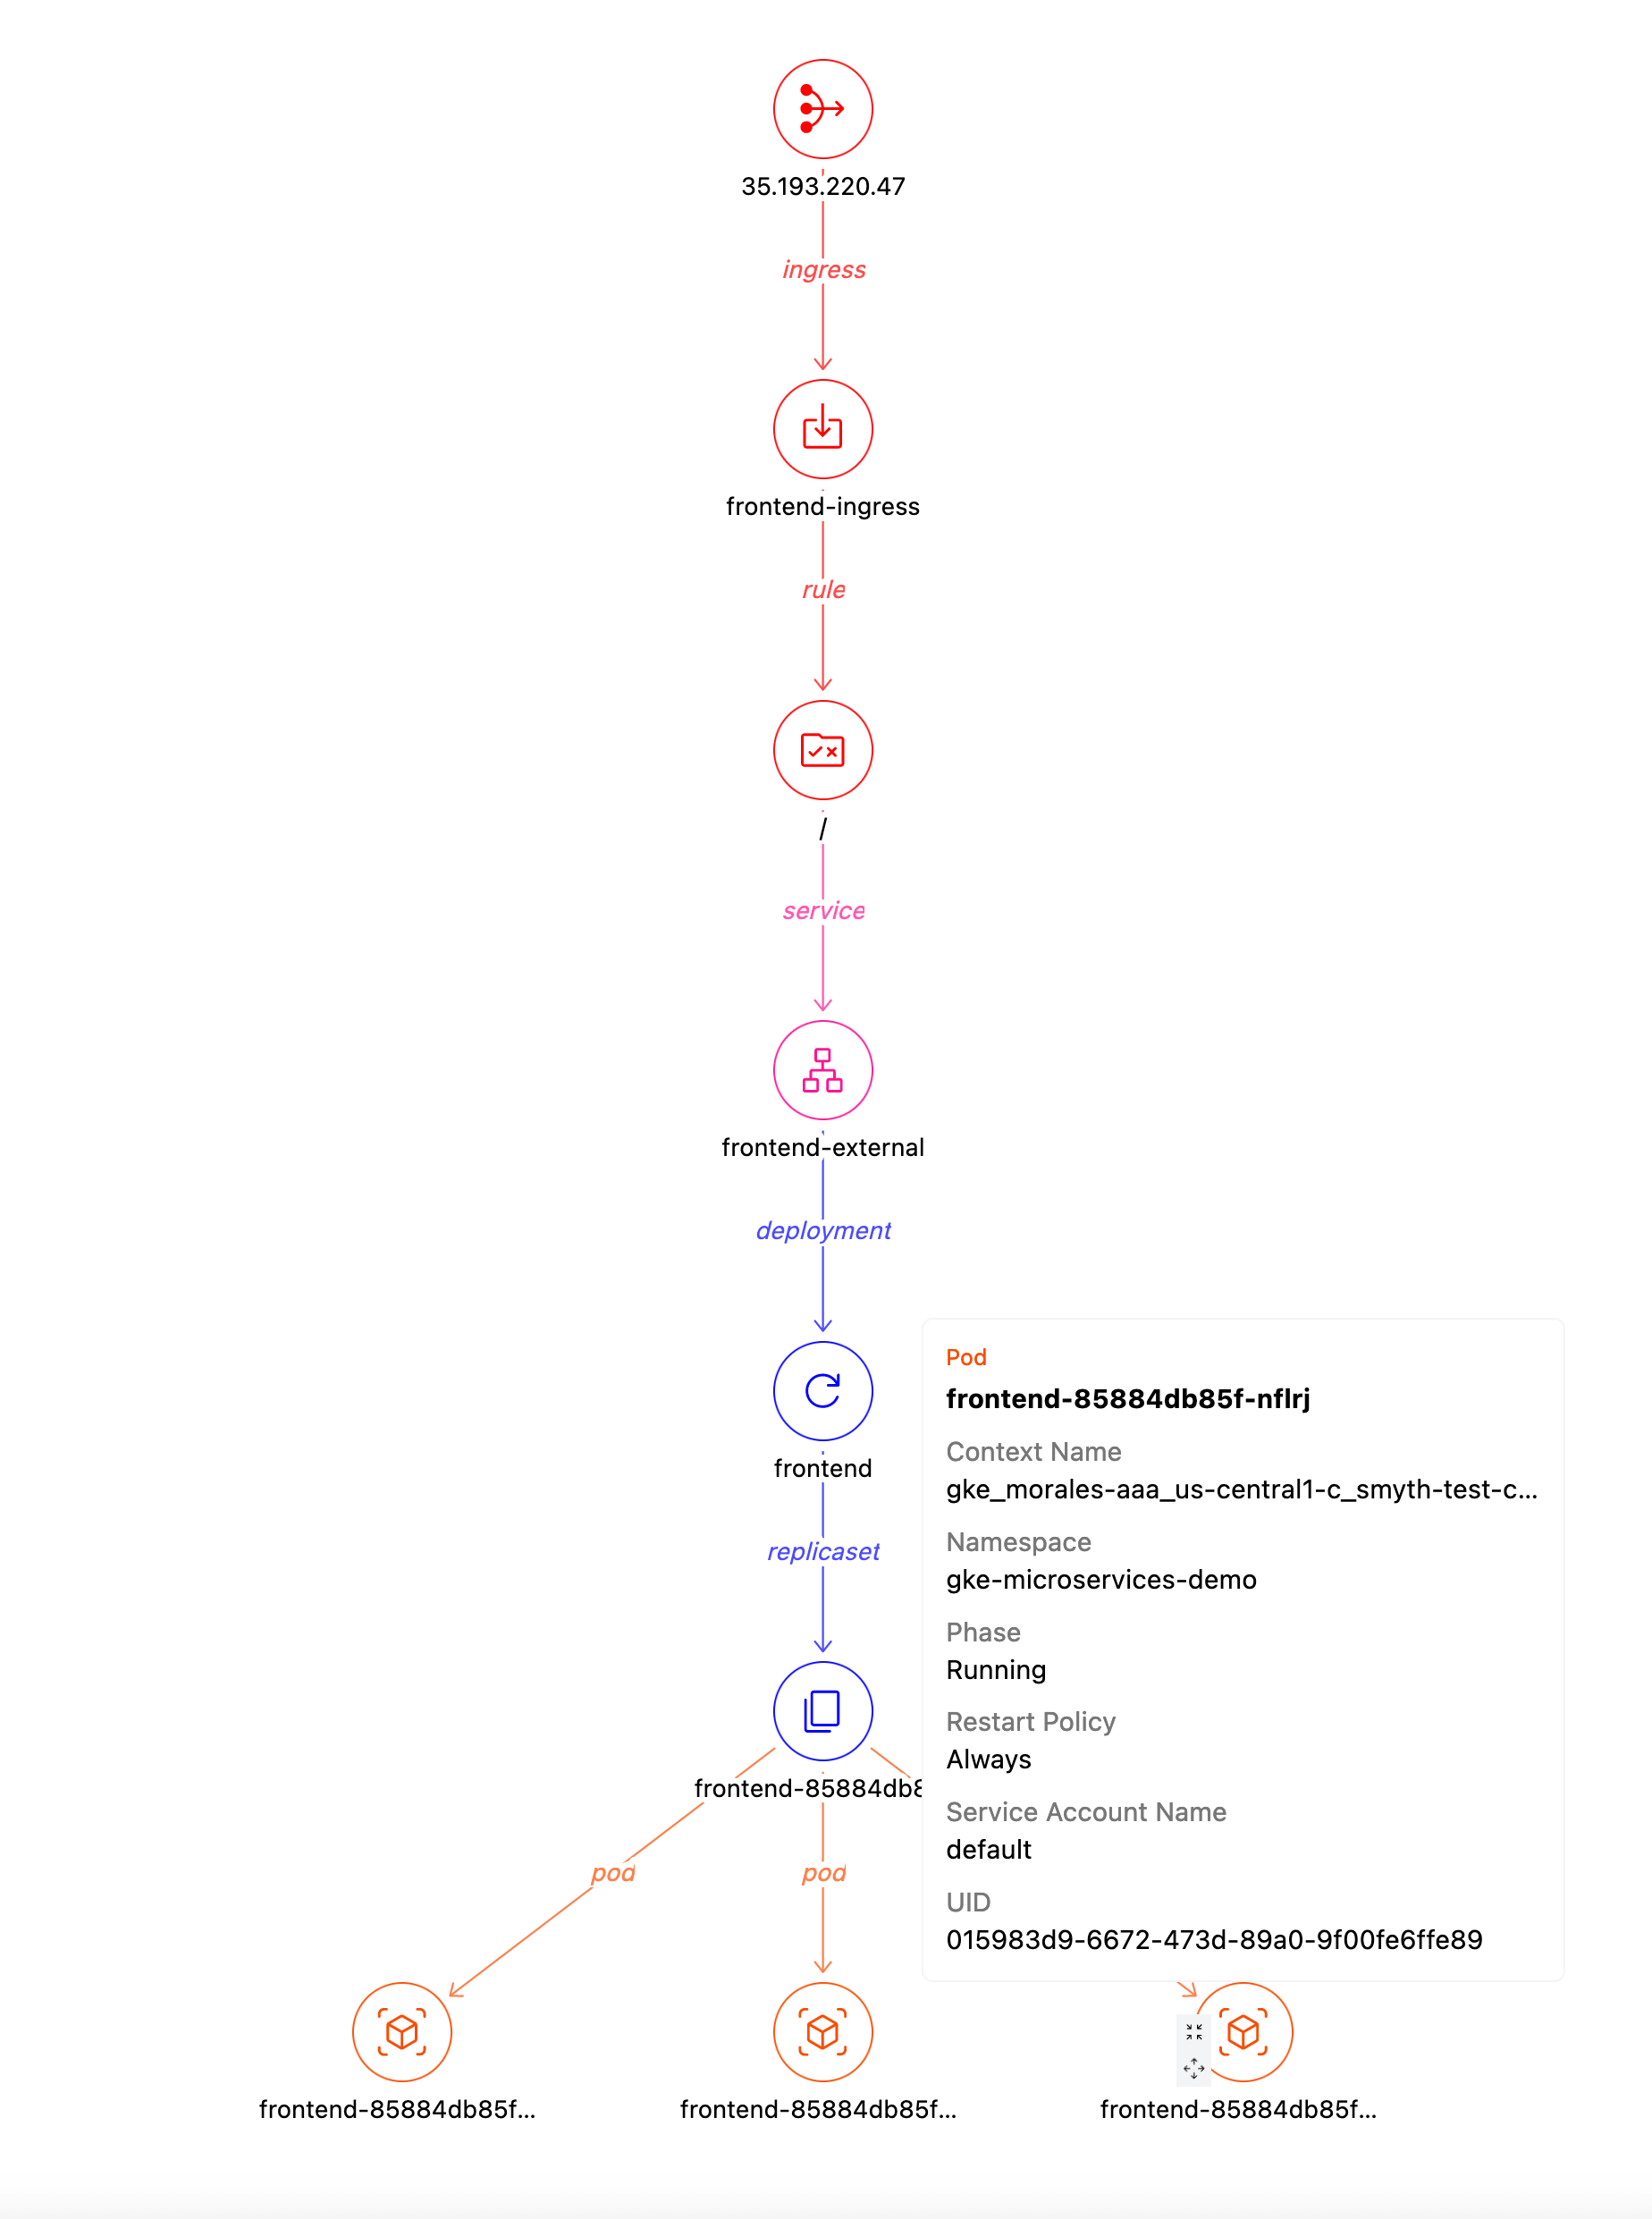
Clicking into the `frontend-external` Service takes us to the [Service Detail](https://hub.steampipe.io/mods/turbot/kubernetes_insights/dashboards/dashboard.service_detail) dashboard where we can see the path from an external IP address to an ingress rule to the `frontend` Deployment with its ReplicaSet of 3 pods.
## Pod dashboard
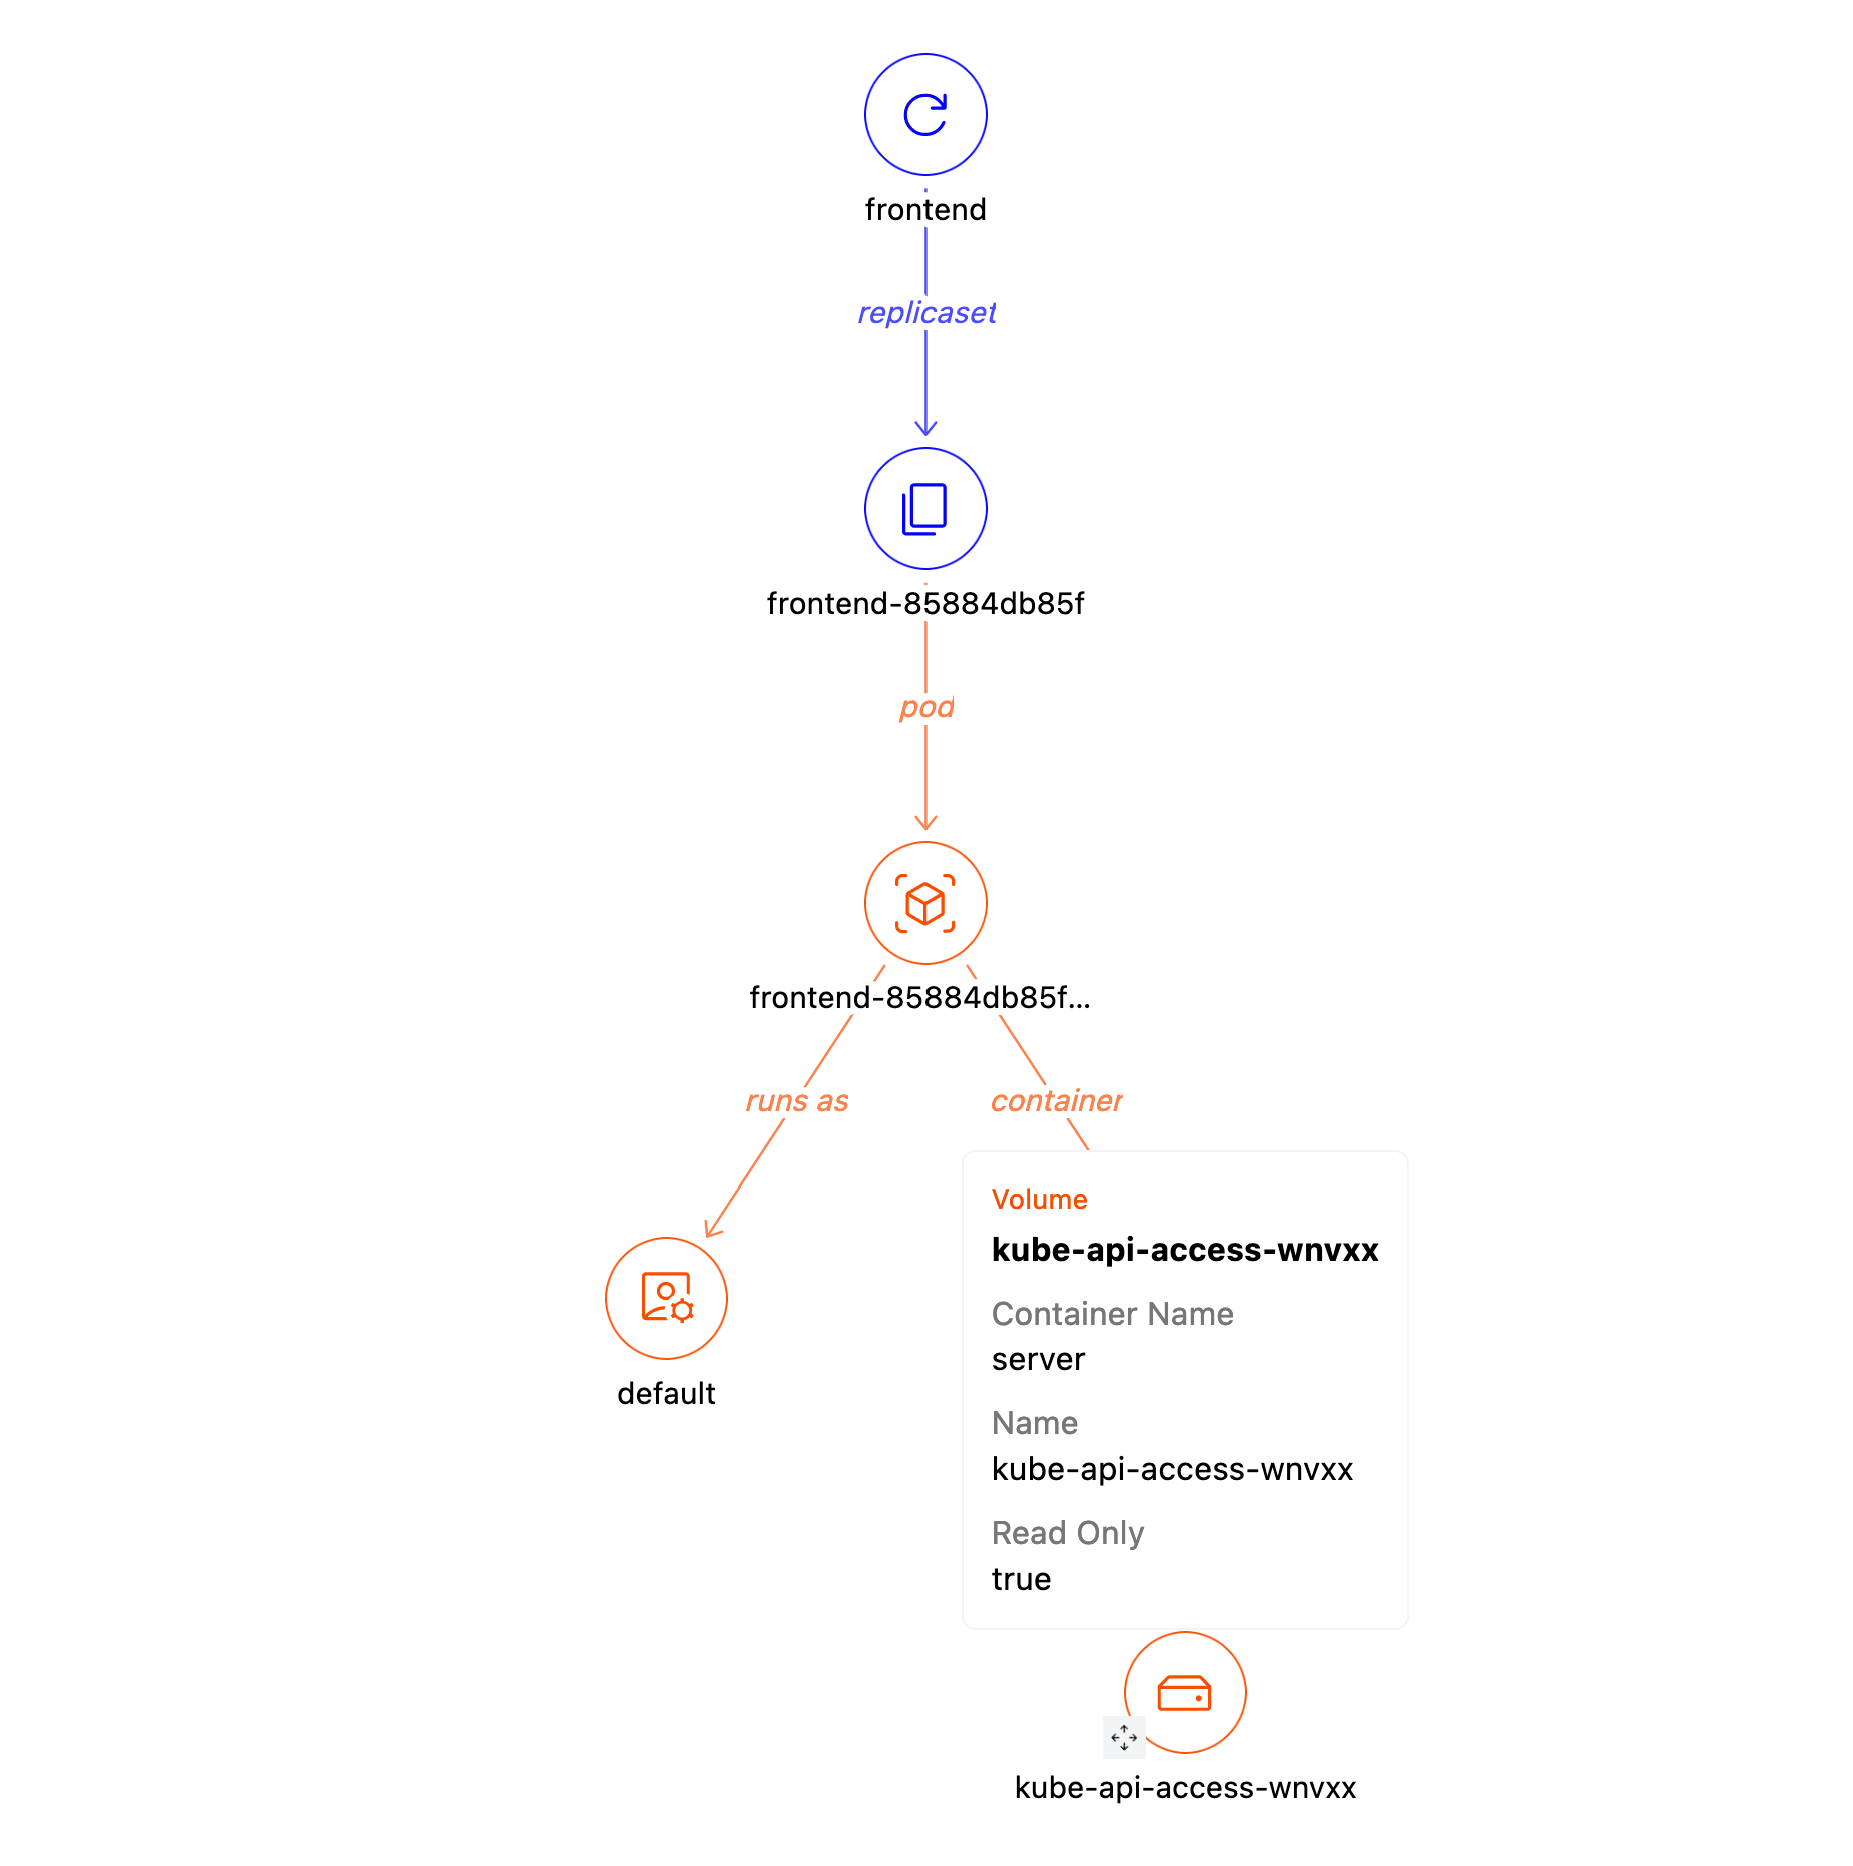
Visiting one those pods takes us to the [Pod Detail](https://hub.steampipe.io/mods/turbot/kubernetes_insights/dashboards/dashboard.pod_detail) dashboard. Here we can see, from another perspective, that it runs as the default service account. We can also see the single container in the pod, and we can see that the counter mounts a read-only volume.
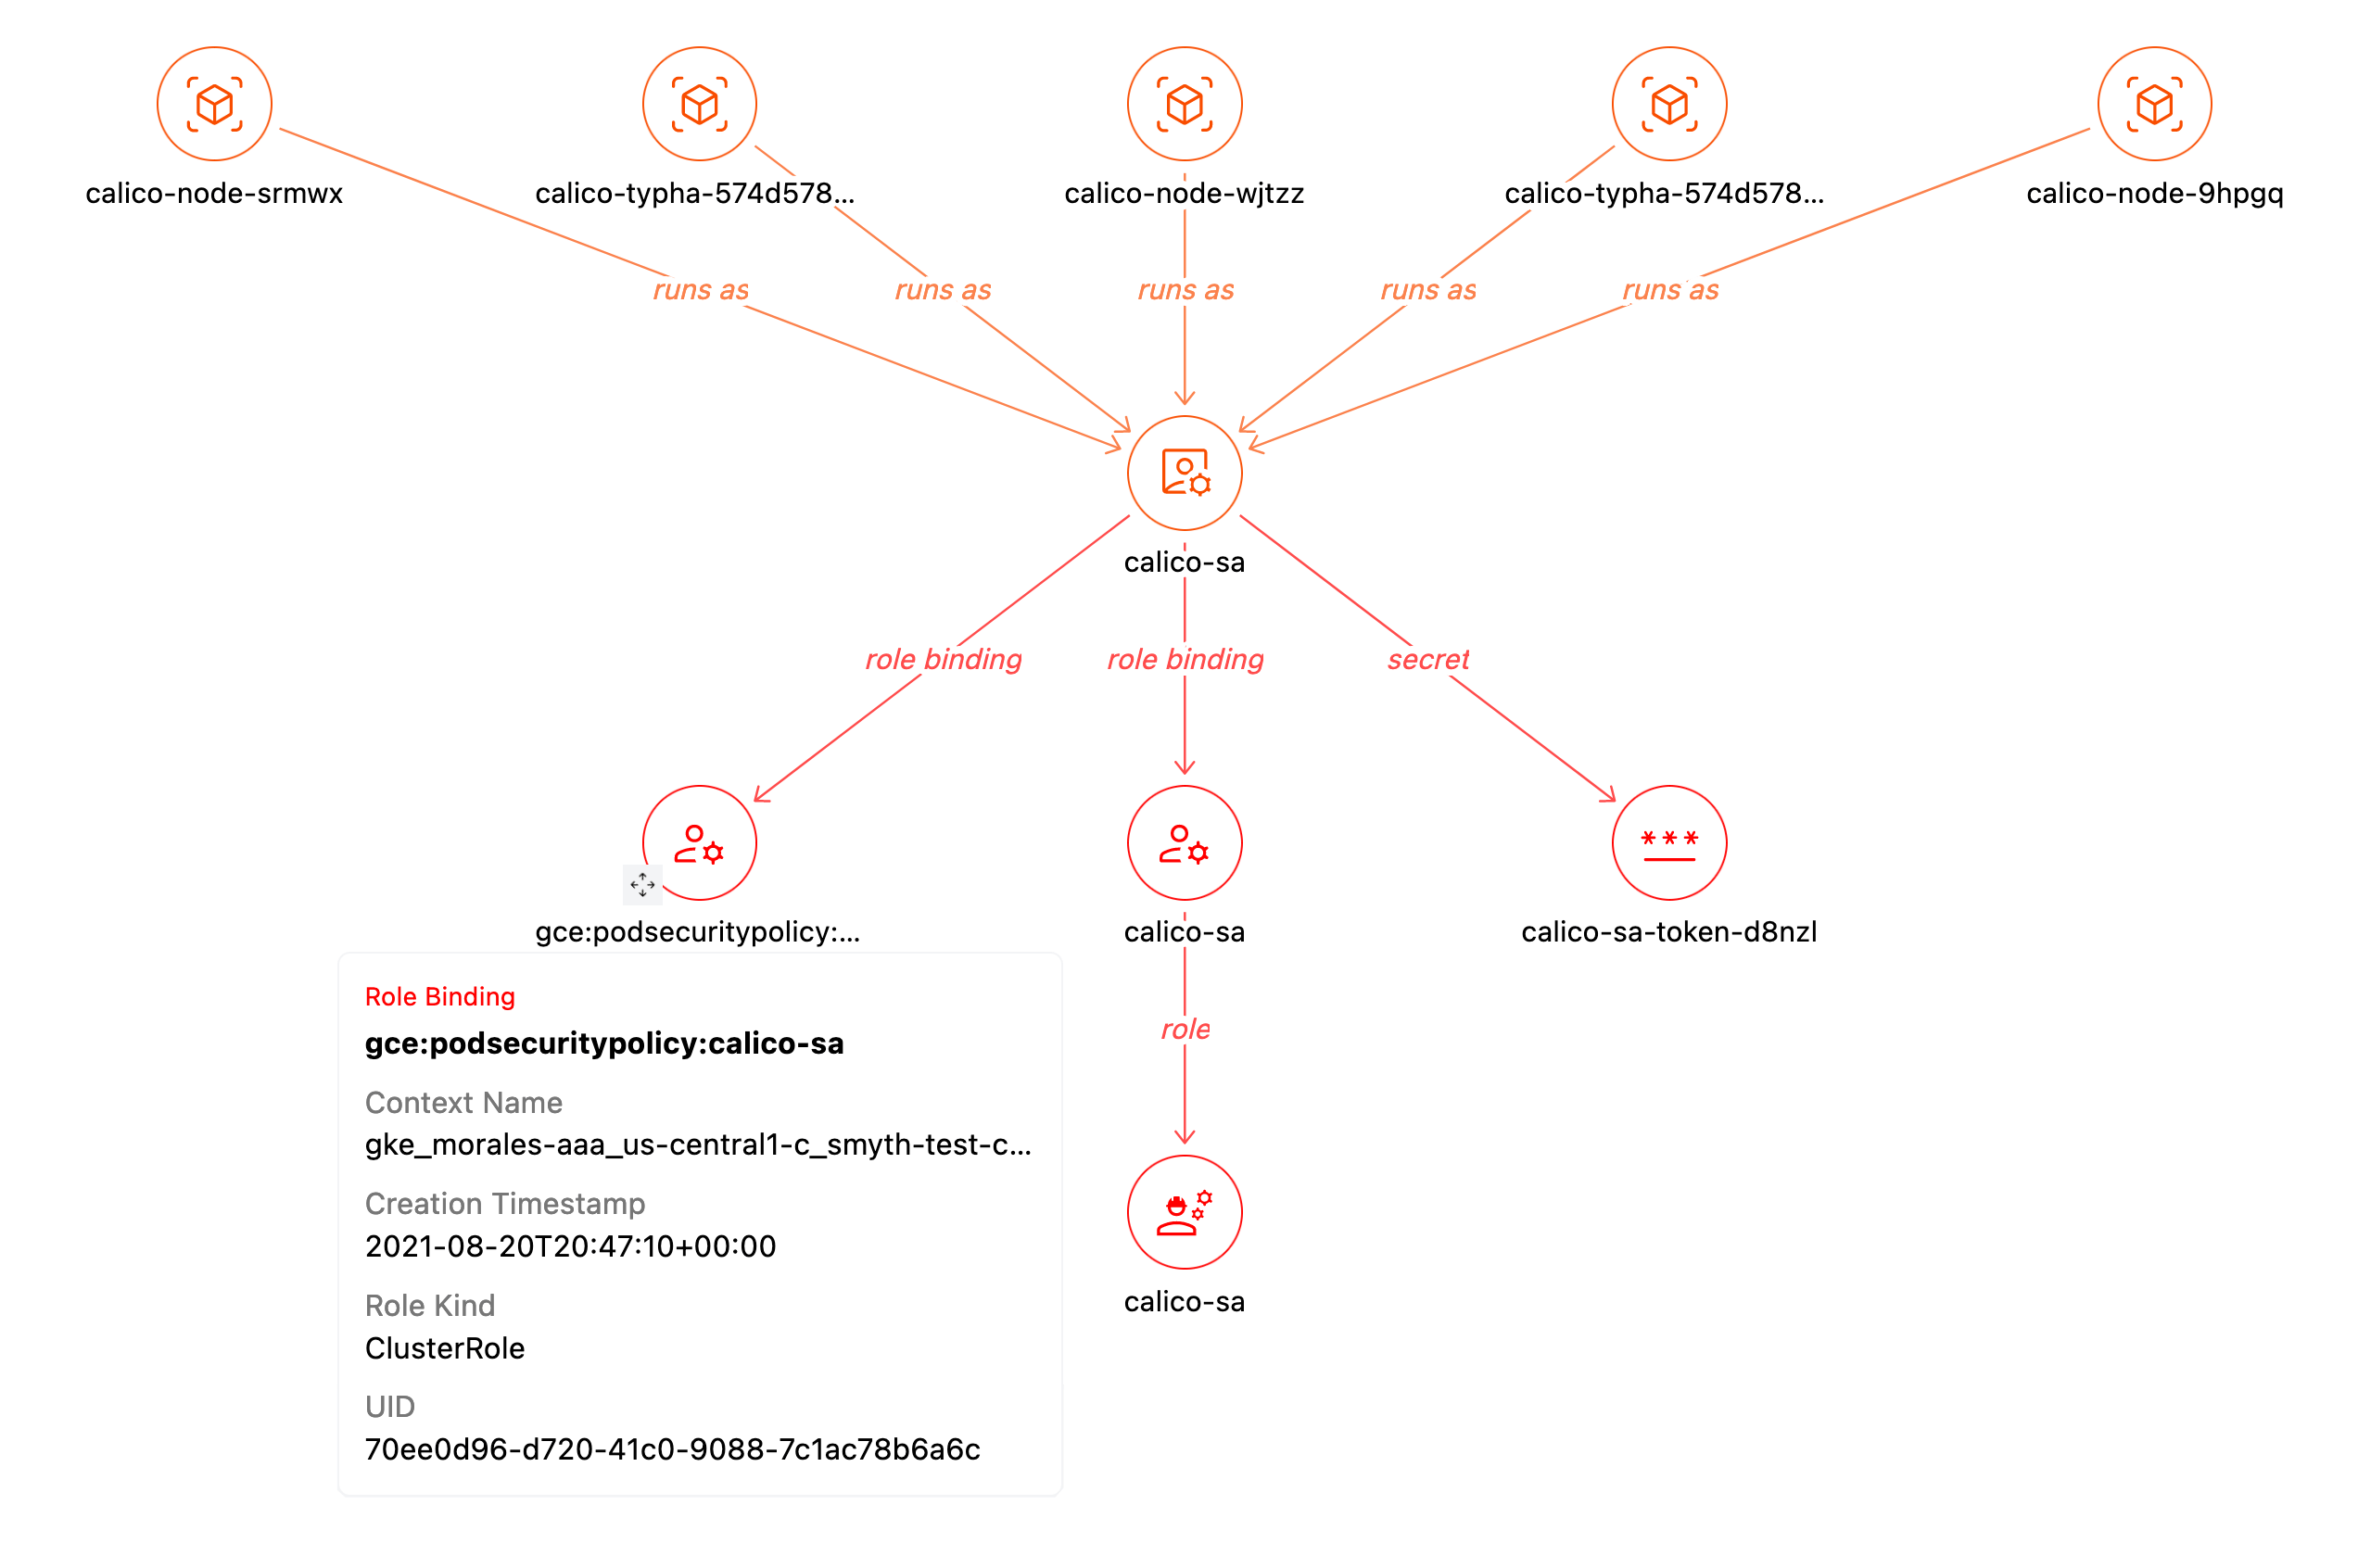
## Service Account dashboard
The default service account is pretty simple, so let's explore a more interesting one. A DaemonSet called *calico-node* has a pod that runs as the *calico-sa* service account. If we open that in the [Service Account Detail](https://hub.steampipe.io/mods/turbot/kubernetes_insights/dashboards/dashboard.service_account_detail) dashboard, we see the 5 pods that run as that service account, the secret it uses, and its role bindings.
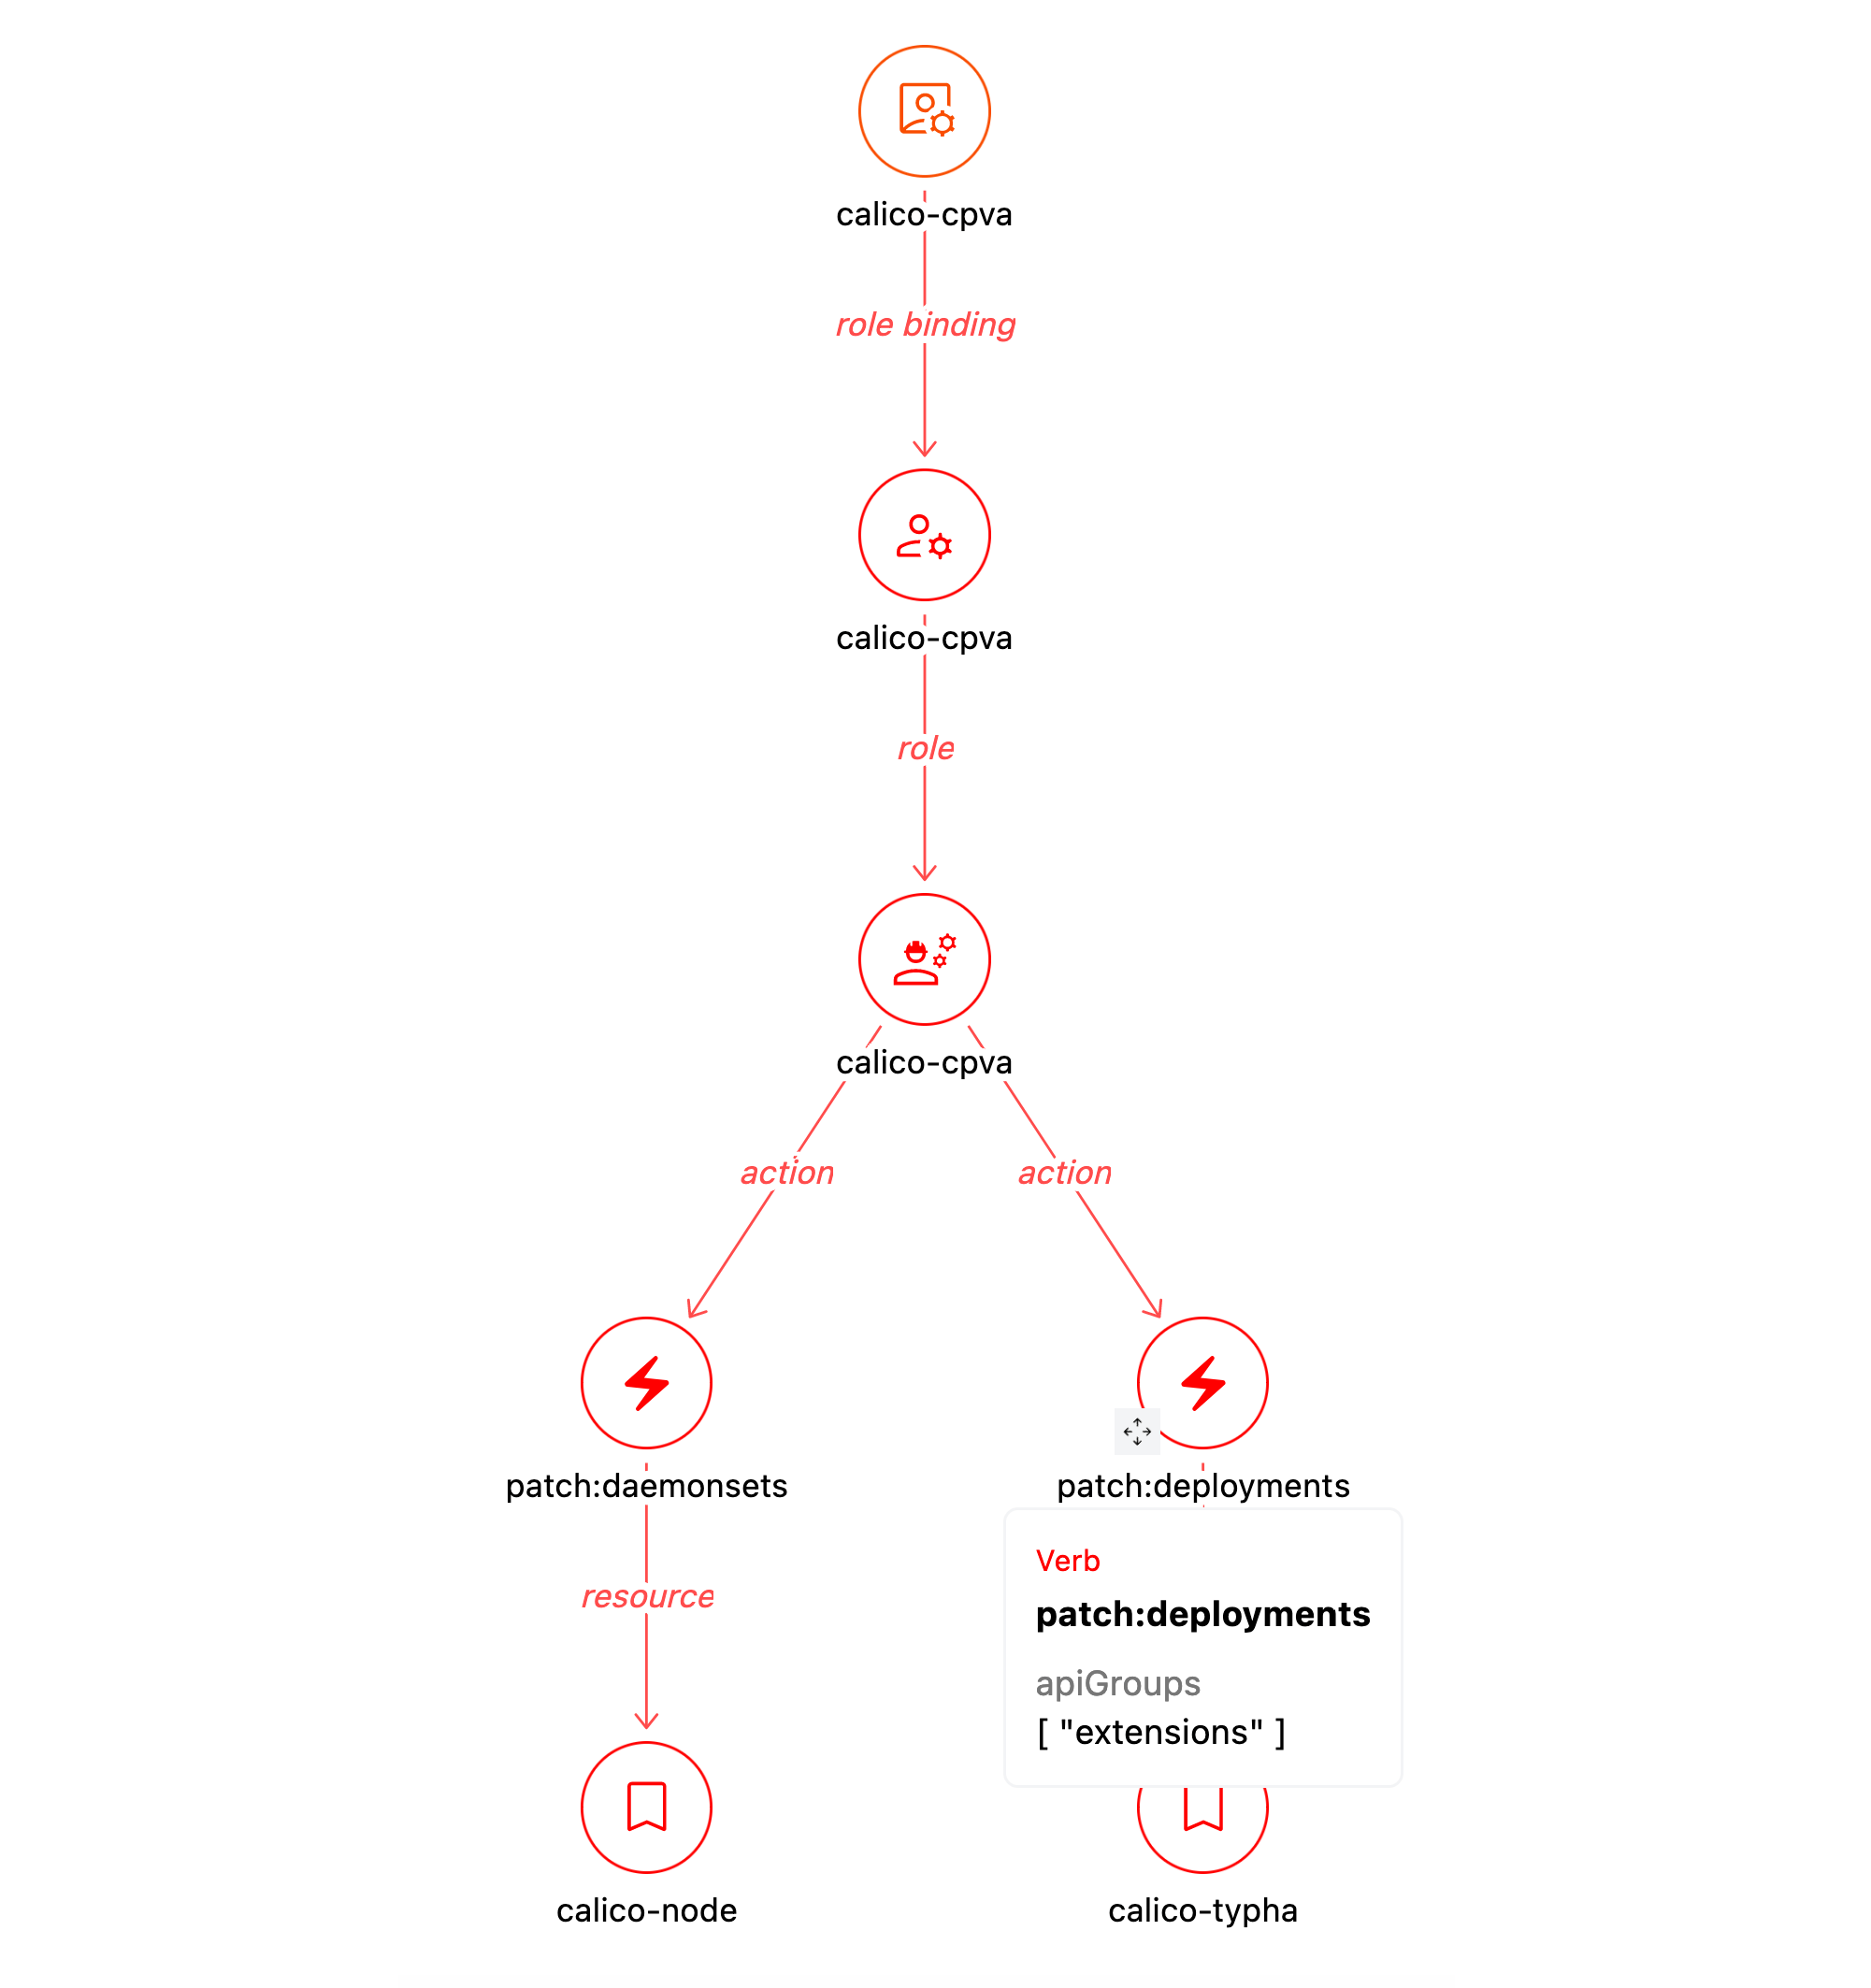
## Role dashboard
The role shown there, *calica-sa*, is again simple, so let's open a more interesting one in the [Role Detail](https://hub.steampipe.io/mods/turbot/kubernetes_insights/dashboards/dashboard.role_detail) dashboard. Here we see that the *calico-cpva* role can patch DaemonSets and Deployments.
## Making Kubernetes legible
These interconnected graphs work hand-in-hand with their dashboards' infocards, charts, and tables to make Kubernetes systems legible in a whole new way. Which of these seem most useful to you? What other kinds of relationships will help you understand your K8s environments and manage them more effectively? We look forward to hearing about your experiences with Kubernetes Insights, and our [Slack community](https://steampipe.io/community/join) is the place to share them.