From July 23, 2022, at 10PM, to July 24 at 5PM, [Pix](https://pix.fr/) was in maintenance mode. The reason? We took advantage of the quiet summer period to migrate the primary identifier of one of the tables in our database from `int` to `bigint`. This follows the [previous migration](https://engineering.pix.fr/bdd/2021/09/03/modifier-type-clef-primaire-non-referencee-vers-biginit.html) last August.
In this situation everyone must be aligned. To do the migration we had to ensure that all the impacted applications are in maintenance mode, and that the database is in the right state, then launch the migration script, wait (a long time), check for correct results, and relaunch the applications.
All this requires good tools, and we have those in abundance. Our kit includes [FreshPing](https://www.freshworks.com/website-monitoring/) for website monitoring, [Datadog](https://www.datadoghq.com/), [Scalingo](https://scalingo.com/) for hosting, and [Confluence](https://www.atlassian.com/software/confluence) for documentation.
But not everyone on staff was fully comfortable with this suite of tools. How could we coordinate their use and present a unified view of the migration? For that we turned to Steampipe. We'd already been running daily queries to check the status of production systems. This would be our first use of Steampipe dashboards. Our migration would be the control tower from which we'd track the chronology of:
1. Putting impacted Pix applications into maintenance mode
2. Performing the migration
3. Reopening
The dashboard code is, like many things at Pix, [available on GitHub](https://github.com/1024pix/steampipe-dashboard-bigint).
## Red green
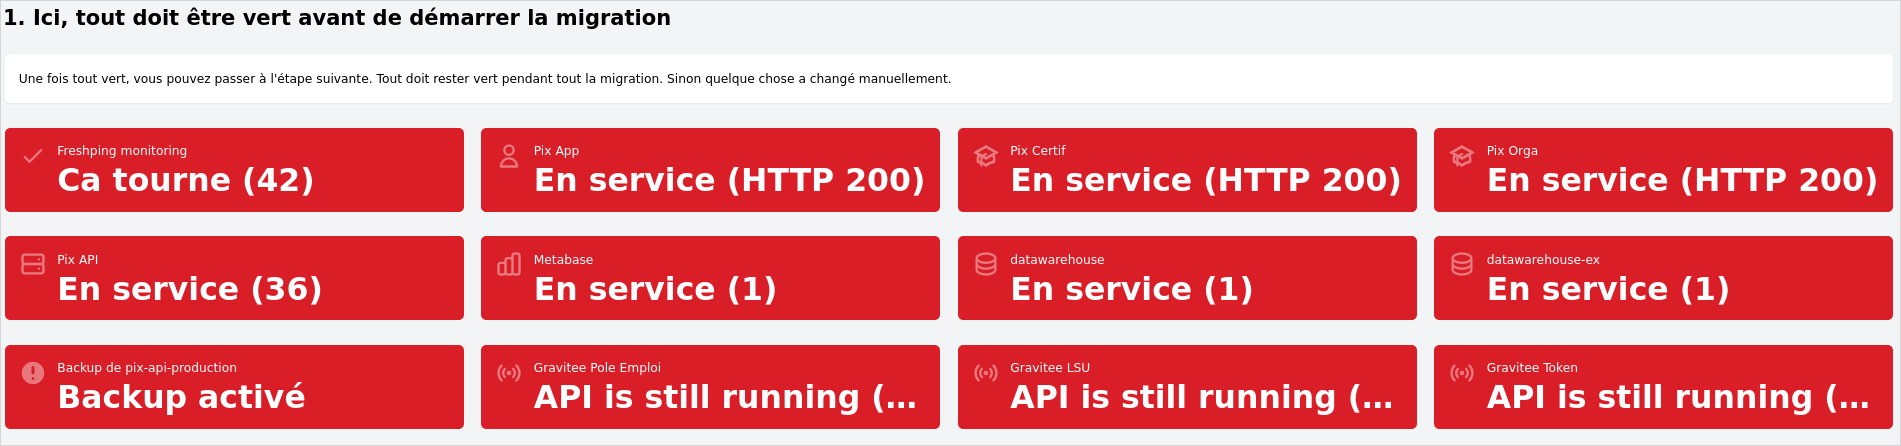
So what does it look like? In step one, everything is initially red.
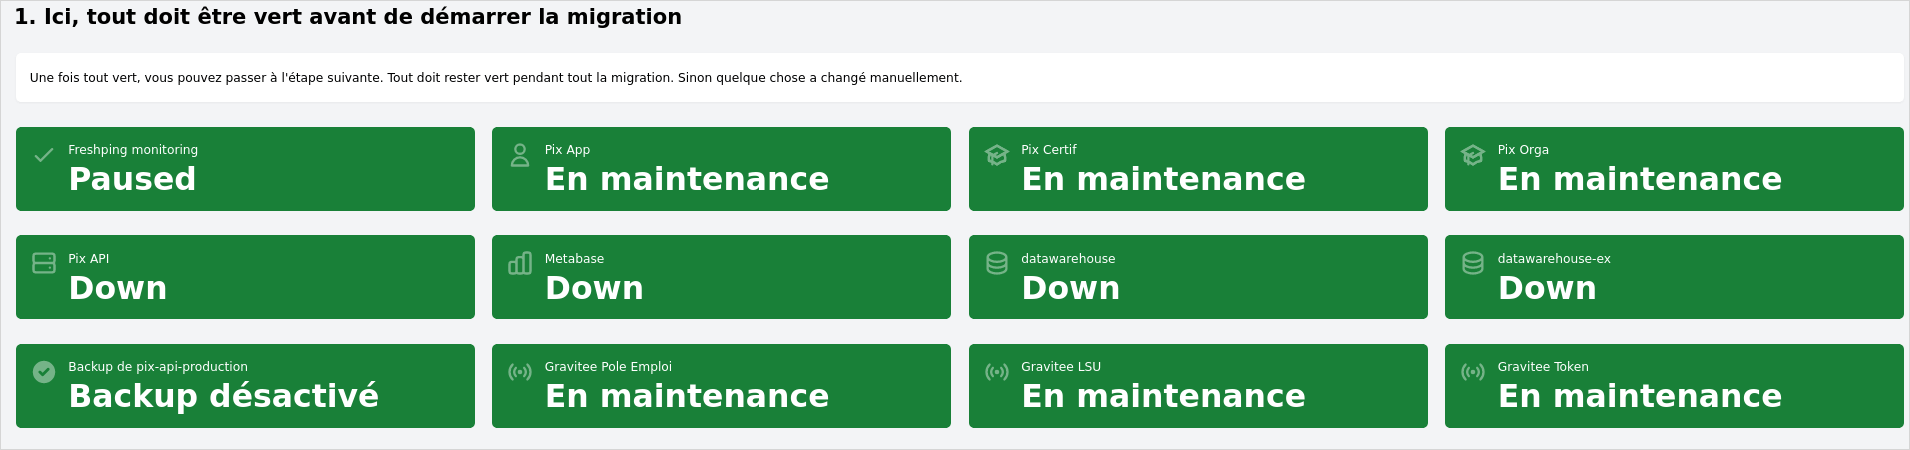
Once all the impacted systems are paused or shut down, the icons go green. (Did you notice the pretty icons?)
Now everything is off, but we still need to check for applications that might have open connections.
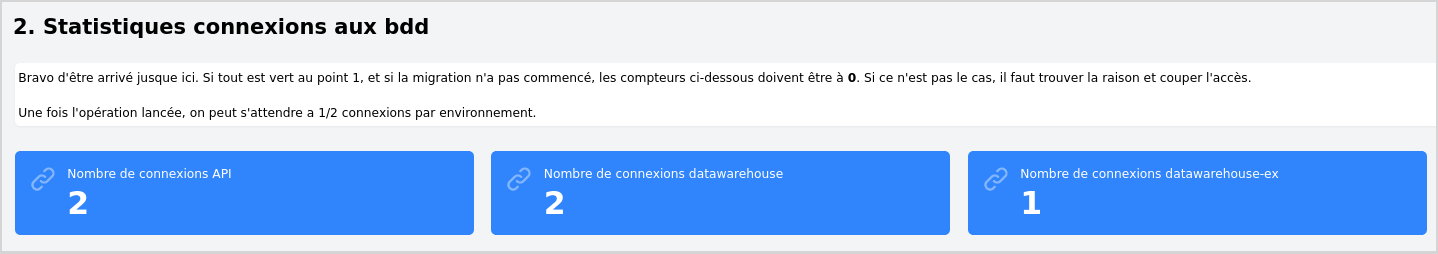
At this point there are still a few open connections, we have to close them to proceed. Once that's done, we can start the migration process.
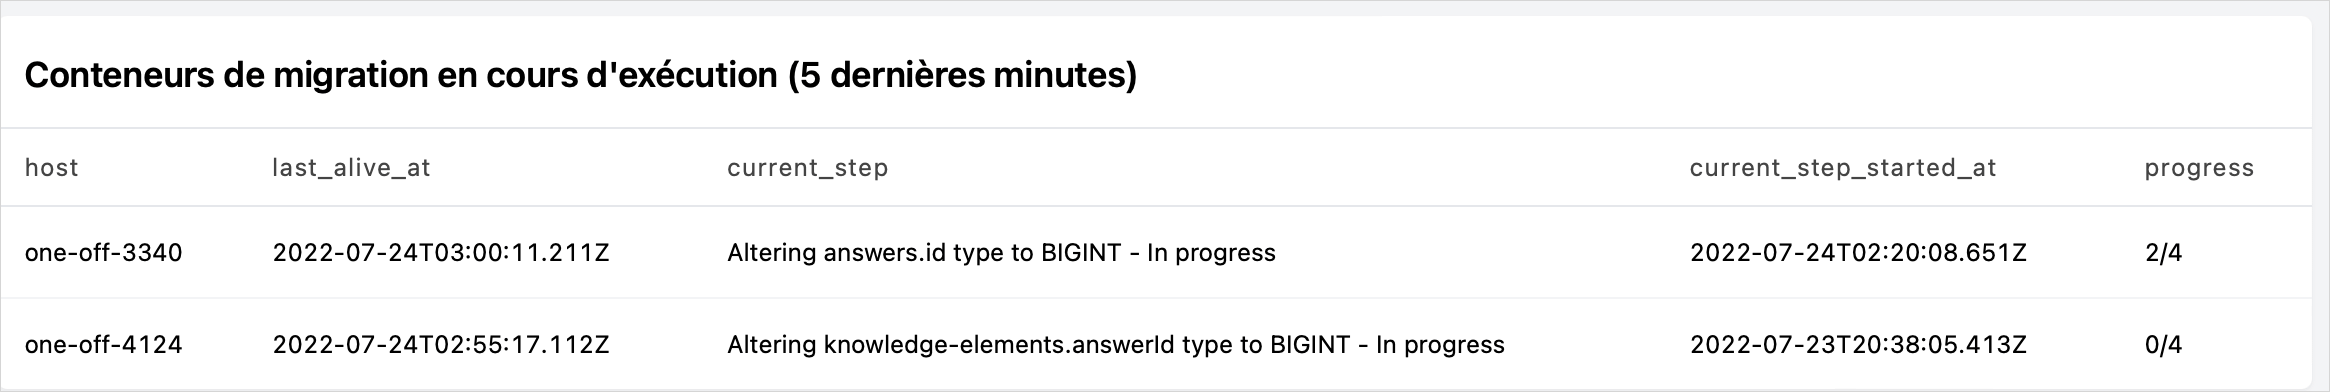
After a few hours, are we there? Not quite.