# v0.18.0: Relationship graphs
> Discover the great new features in Steampipe's open source v0.18.0 release!
By Steampipe Team
Published: 2023-01-12
# Introducing relationship graphs
Steampipe's ability to query cloud assets -- rapidly, at scale, across accounts and regions -- can deliver a flood of information. To help you make sense of it we added dashboards like [AWS Insights](https://hub.steampipe.io/mods/turbot/aws_insights) to summarize the data using charts and tables, navigate from overviews like the [AWS EC2 Instance Dashboard](https://hub.steampipe.io/mods/turbot/aws_insights/dashboards/dashboard.ec2_instance_dashboard) to detail views like [AWS EC2 Instance Detail](https://hub.steampipe.io/mods/turbot/aws_insights/dashboards/dashboard.ec2_instance_detail), and see relationships as [flow diagrams](/docs/reference/mod-resources/flow).
The new relationship graphs in v0.18 turbocharge Steampipe's ability to help you see and navigate relationships among your cloud assets. Consider this EC2 instance:
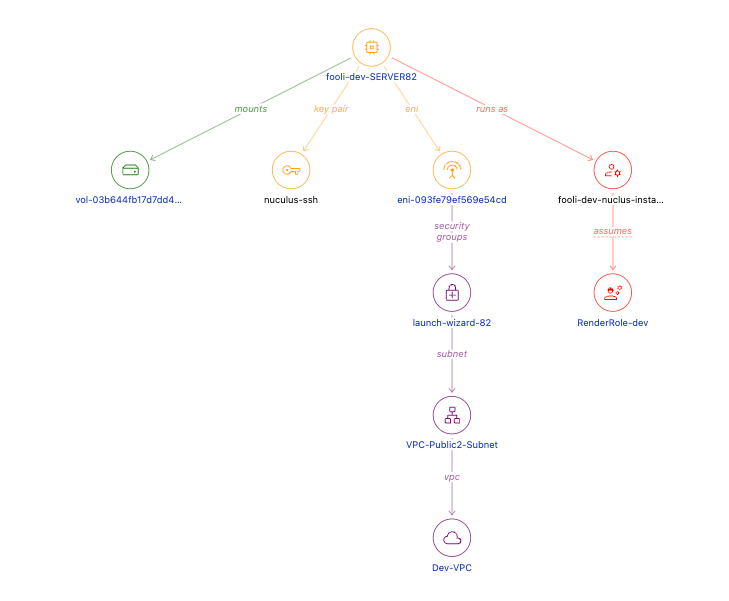
You can immediately visualize the instance with its full context including volumes, key pairs, network topology and IAM permissions.
Hovering resources in the graph allows you to peek at their details, or click the link (e.g. the VPC) to see a graph of that resource and its own context.
## Context is king
Relationship graphs make your cloud simpler and immediately highlight important information.
* Understand relationships and dependencies at a glance: What services log to this S3 bucket? What instances are targeted by this load balancer? What IAM role is used by this Lambda function? Does this VPC use peering?
* Review architecture and topology: What is the network structure of this VPC? Is this application balanced across availability zones? Is my RDS instance in the database subnet?
* Identity and permissions: What users are in this group? What resources use this IAM role? What permissions are granted by this principal?
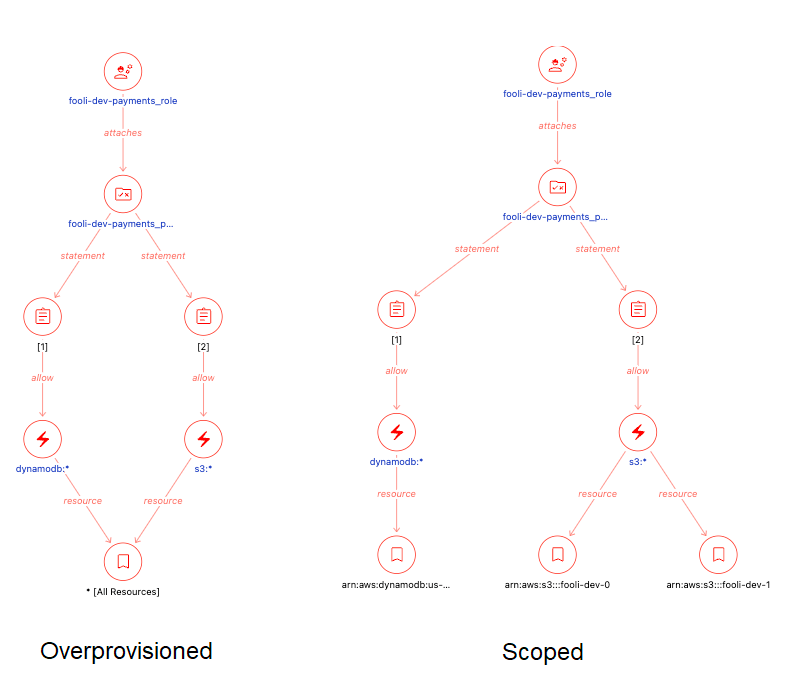
For example, here we visualize the details of an IAM policy and can immediately see if least privilege has been followed or not:
## Massive mod updates
As always in Steampipe, the batteries are included. Today we're also releasing updated Insights mods for AWS, Azure & GCP that include relationship graphs for all the resources you care about in those clouds.
| Mod | Dashboards | Queries |
| - | - | - |
| [AWS Insights](https://hub.steampipe.io/mods/turbot/aws_insights) | 137 | 1,399 |
| [Azure Insights](https://hub.steampipe.io/mods/turbot/azure_insights) | 45 | 592 |
| [GCP Insights](https://hub.steampipe.io/mods/turbot/gcp_insights) | 26 | 317 |
## Snapshot your graphs
Graphs are just panels in existing Steampipe dashboards. They load from live data and can be [saved as snapshots](/blog/release-0-17-0). This means you can create a graph of your AWS EC2 instances, save it, share it with your team, then see it change over time.
## Dashboards as code
The work we've done to enhance these dashboards is open source so you can inspect, modify, and remix. To simplify the creation of relationship graphs -- for ourselves and for you -- we've added two new HCL blocks to represent the nodes and edges of these graphs. A [node](/docs/reference/mod-resources/node) represents one or more cloud resources: compute instances, virtual networks, roles, volumes. Here's a node for an EC2 instance.
```hcl
node "ec2_instance" {
category = category.ec2_instance
sql = <> 'Name',
'ARN', arn,
'Account ID', account_id,
'Region', region
) as properties
from
aws_ec2_instance
EOQ
}
```
It's a query that returns, for a set of instances, the columns `id`, `title`, and `properties`. The `title` column makes the node legible on a graph, and `properties` supplies more contextual info, but only `id` is required. That's the value that connects this node to other kinds of nodes by way of an [edge](/docs/reference/mod-resources/edge). The `category` argument points to a definition that controls the node's icon and color and defines its link, in this case to the instance's detail view.
```hcl
category "ec2_instance" {
title = "EC2 Instance"
color = local.compute_color
href = "/aws_insights.dashboard.ec2_instance_detail?input.instance_arn={{.properties.'ARN' | @uri}}"
icon = "memory"
}
```
Here's an edge that connects an EC2 instance to a volume that it mounts. Again it's a query, in this case parameterized by ARN, that returns the required columns `from_id` (the instance that mounts the volume) and `to_id` (the volume that it mounts).
```hcl
edge "ec2_instance_to_ebs_volume" {
title = "mounts"
sql = < 'Ebs' ->> 'VolumeId'
and i.arn = any($1);
EOQ
param "ec2_instance_arns" {}
}
```
Nodes and edges come together in [graph](/docs/reference/mod-resources/graph) blocks to produce the combined result set that the graph visualizer renders. It's not strictly necessary to define nodes and edges, you can use the original [monolithic](/docs/reference/mod-resources/graph#monolithic-query) format, but we recommend using node and edge blocks which are named resources that you can reuse across graphs.
## Let's get building!
Have fun working with these new graphs and components! We hope you'll share screenshots and snapshots to show us what you've done.
The Steampipe ecosystem now offers more than 90 plugins; each provides several, or dozens, or even hundreds of tables. You've always been able to use SQL to join those tables not only within an API family like AWS, but across diverse APIs. Now you can also use SQL to build relationship graphs within and across APIs. If you can imagine a useful way to visualize your team's activity in GitHub as it relates to conversations in Slack, you can now build that graph. The sky's the limit, and we look forward to hearing about your adventures in our [Slack community](https://steampipe.io/community/join).