# Reuse and remix Steampipe benchmarks and dashboards
> The Steampipe ecosystem provides thousands of named resources you can include in custom dashboards. But don't stop there, you can easily mix in your own queries and controls.
By Jon Udell
Published: 2023-02-07
Steampipe provides a large and fast-growing collection of named resources that are all available to you to study, reuse, and modify. As of today the tally stands at 3,390 controls and 5,372 queries. Remixing first became possible in v0.11. We introduced [composable mods](https://steampipe.io/blog/release-0-11-0#composable-mods) that you install in a hidden local directory, like npm modules, and then reference by name. The example we gave there did four things:
1. Install local copies of two mods: `steampipe mod install github.com/turbot/steampipe-mod-aws-compliance`, `steampipe mod install github.om/turbot/steampipe-mod-github-sherlock`.
2. Create a version of `aws_compliance` that cherrypicks just sections 1, 2, and 3 from cis_v140.
3. Create a version of `github_sherlock` that cherrypicks two of its four benchmarks.
4. Add a semantic versioning check to our own version of `github_sherlock`.
A lot has changed since then, notably Steampipe's novel [dashboards-as-code](https://steampipe.io/blog/dashboards-as-code) approach which debuted in v0.13. Nowadays you can not only cherrypick and remix benchmarks and controls, you can also mix those ingredients on custom dashboards along with tables, charts, and interactive inputs.
You may never need to remix these resources. When you use the 22 dashboards provided by a mod like [AWS Compliance](https://hub.steampipe.io/mods/turbot/aws_compliance) you aren't just tapping into a vast pool of reusable resources (698 controls, 360 queries). You're also leveraging the editorial choices made by the AWS experts who created the dashboards. In many cases their choices will meet your needs.
But there are always exceptions: a question those dashboards don't answer, a novel benchmark you'd like to include. In such cases you want to be able to modify or extend the official Steampipe dashboards and benchmarks, and avoid conflicting with them as they evolve. Let's explore how to do that.
The remixed mod we'll discuss here is available in [steampipe-samples](https://github.com/turbot/steampipe-samples/tree/main/all/dashboard-remix), and comprises two dashboards.
## Part 1: VM overviews for AWS and Azure, side-by-side
The first dashboard looks at compute resources across two clouds: AWS and Azure. It comprises two panels, each defined by a [container](https://steampipe.io/docs/reference/mod-resources/container) that groups and arranges resources within a dashboard.
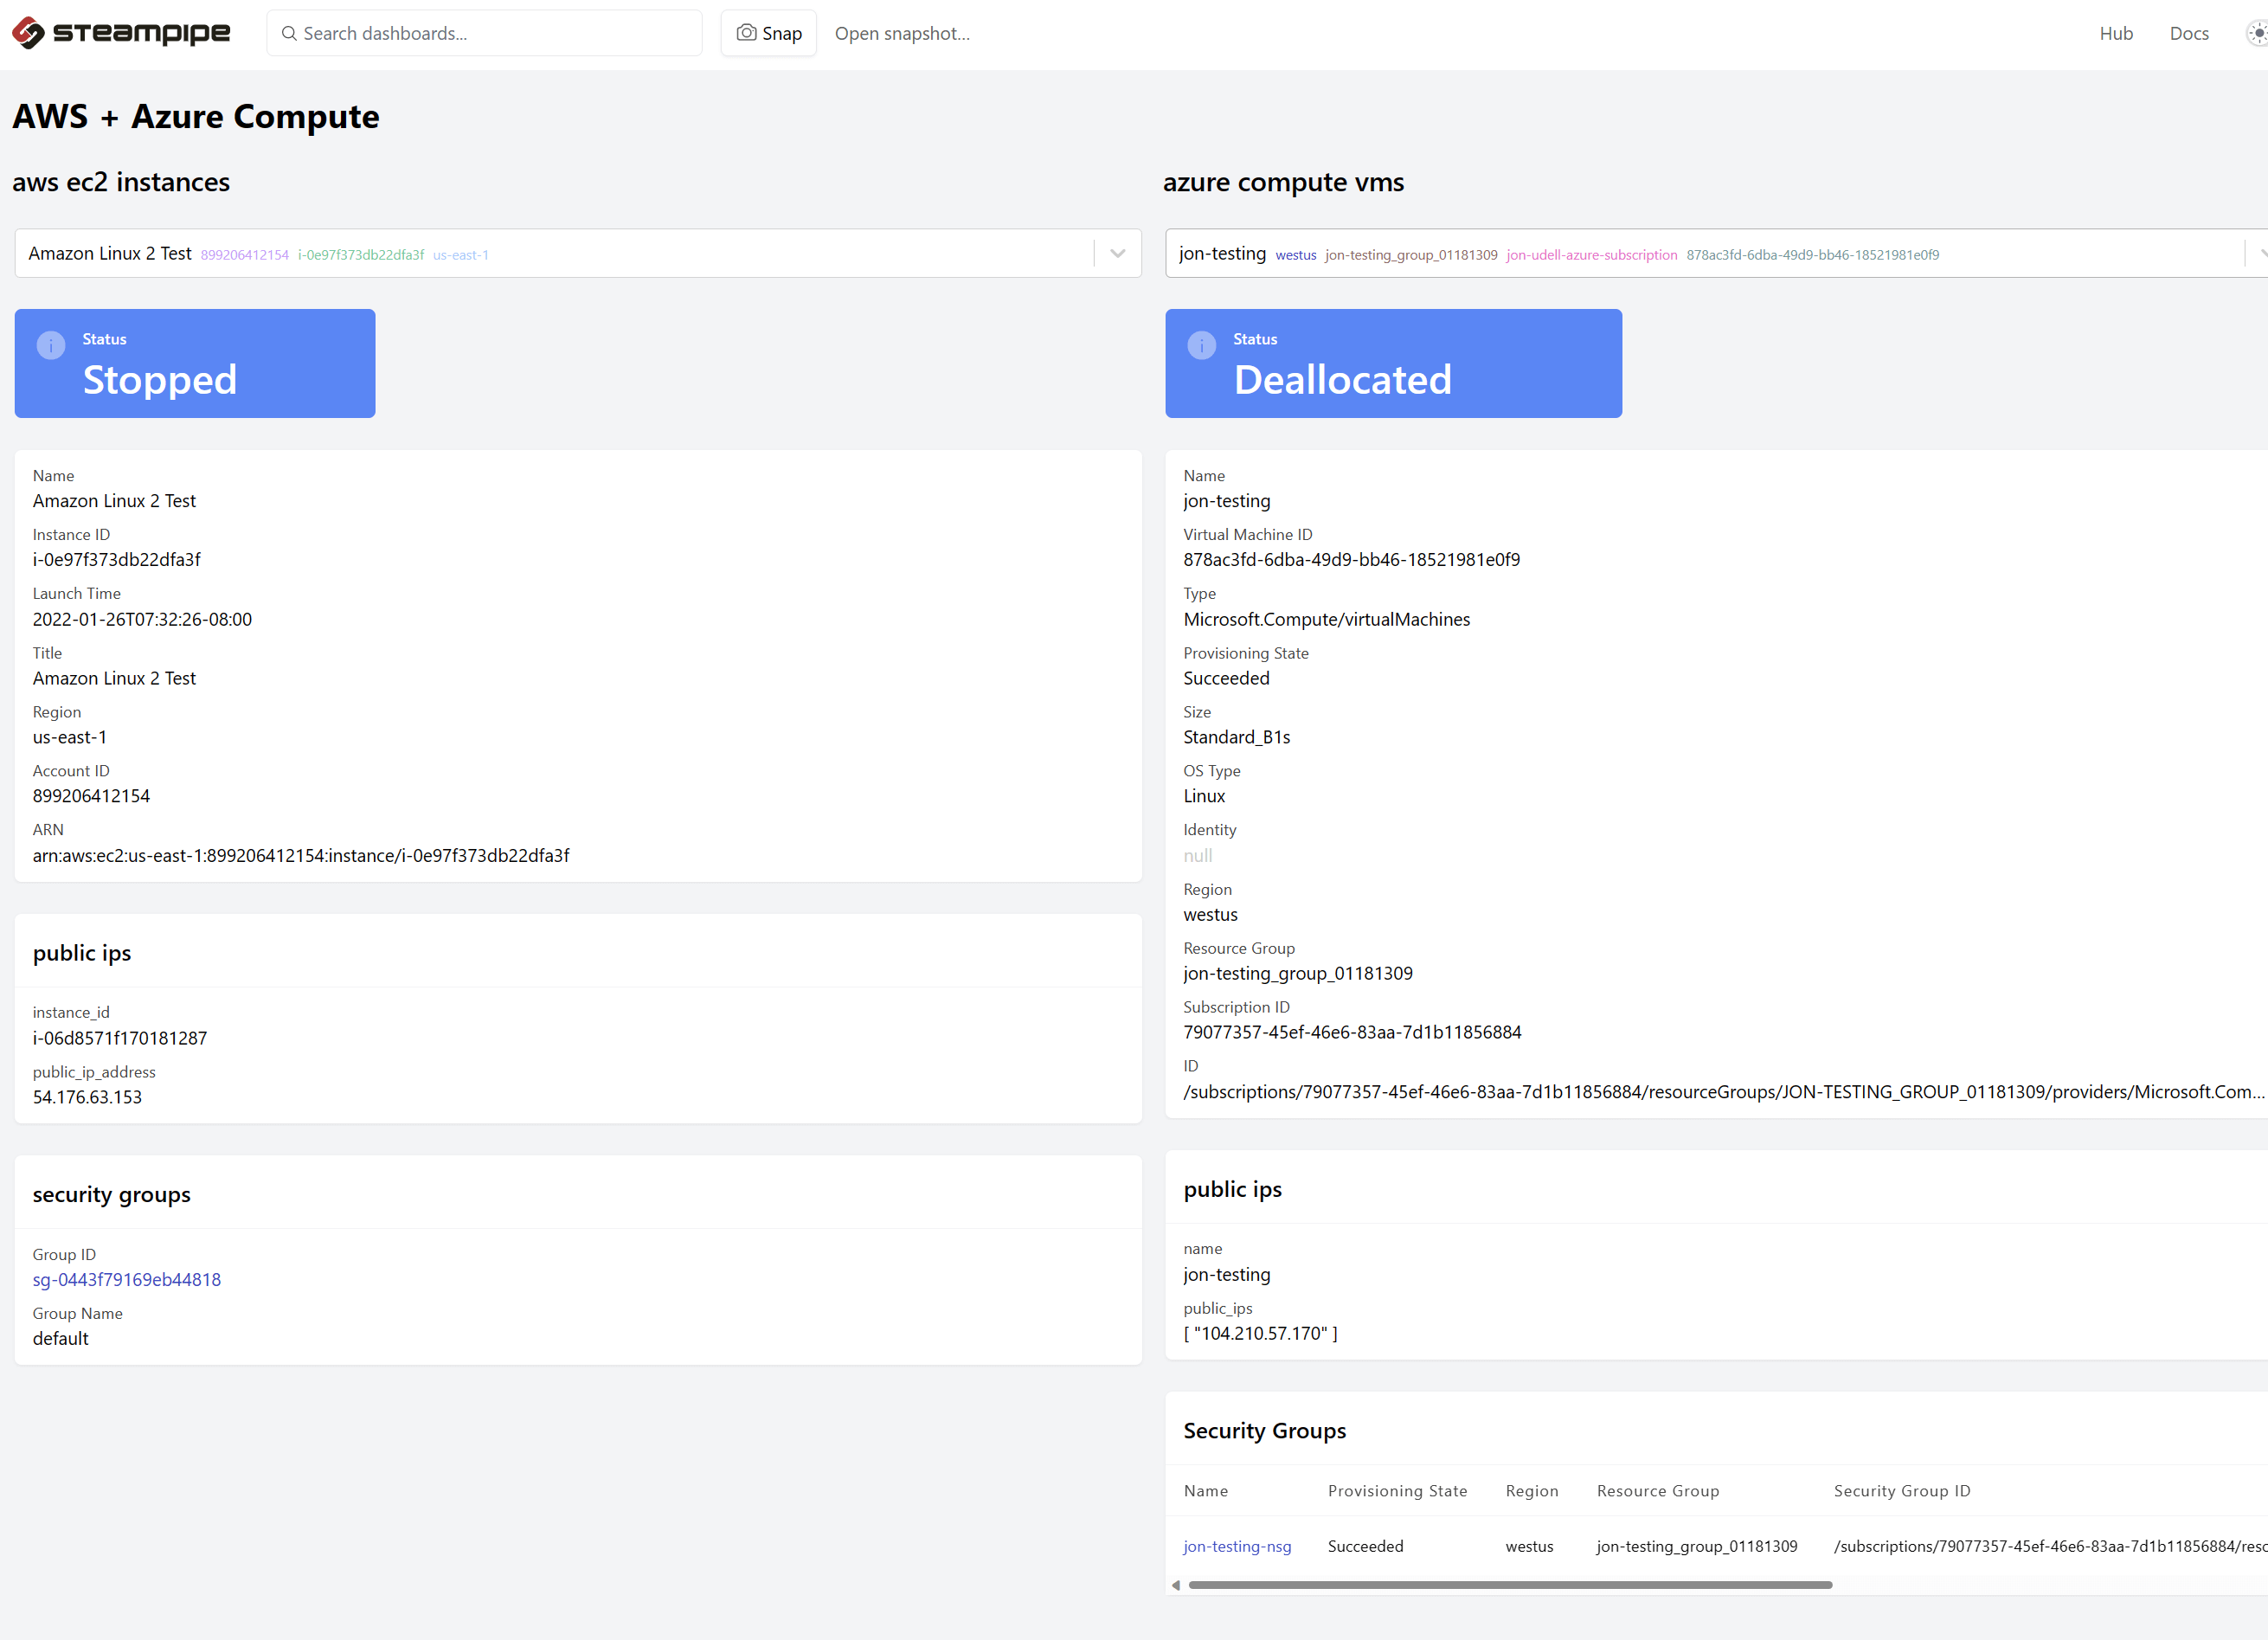
Each container includes an [input block](https://steampipe.io/docs/reference/mod-resources/input) that selects a compute resource, either an AWS EC2 instance or an Azure compute VM. Each of these input blocks is driven by a SQL query provided by an installed mod.
For AWS:
```
input "instance_input" {
query = aws_insights.query.ec2_instance_input
}
```
For Azure:
```
input "vm_input" {
query = azure_insights.query.compute_virtual_machine_input
}
```
The dashboard user can select a VM in either panel to view its summary, its public IP addresses (if any), and its security groups. Note the syntax: each query is qualified by the name of the installed mod on which this custom mod [depends](https://steampipe.io/docs/mods/mod-dependencies).
Just as the two panels use cloud-specific `input` blocks, they also use cloud-specific [card](https://steampipe.io/docs/reference/mod-resources/card) blocks to display the status (e.g. stopped for AWS, deallocated for Azure). But here there's a difference.
For AWS:
```
card "ec2_instance_status" {
width = 2
base = card.ec2_instance_status
}
```
For Azure:
```
card {
width = 5
type = "info"
query = azure_insights.query.compute_virtual_machine_status
args = [self.input.vm_input.value]
}
```
The Azure card refers to a named query in the installed mod, and passes an input from a block that also refers to the installed mod. But the AWS card uses the `base` argument to refer to a block that's defined locally (in `named_resources.sp`), which in turn refers to a query in the installed mod.
```
card "ec2_instance_status" {
type = "info"
width = 4
args = [ self.input.instance_input.value ]
query = aws_insights.query.ec2_instance_status
}
```
The remixed mod uses the input block in both of its dashboards, so it's convenient to define it once and then reference it from both places. Although we don't do so in this case, the per-dashboard input blocks can vary arguments (`type`, `info`) inherited from the base.
Similarly, `named_resources.sp` defines three tables for reuse across the two dashboards. Here are two of them.
```
table "ec2_instance_overview" {
query = aws_insights.query.ec2_instance_overview
}
table "ec2_public_ips" {
title = "public ips"
type = "line"
sql = <can embed a control set in a dashboard, and that it can include controls that normally belong to different benchmarks. Why would you do that? If your goal is to show compliance with CIS 1.5, HIPAA, or PCI v3.2.1, you wouldn't. But if you want to build a thematic control set, for example one that displays all available compute-related controls, you can.
This panel also shows, again, that you can mix named resources referenced in installed mods with your own named resources that you create locally. Here the local resource is the `ec2_instance_project_tag` control. [AWS Tags](https://hub.steampipe.io/mods/turbot/aws_compliance/controls) checks for the existence of a (user-configurable) list of mandatory tags. But suppose you want to have an optional Project tag on your EC2 instances. It's not required, but when used the value must be one of a controlled list of project codenames. This control, which is included in the synthetic benchmark that runs in the right panel, does that.
```
locals {
project_tag_values = ["Boston", "Cairo", "Kolkata"]
}
control "ec2_instance_project_tag" {
args = [ local.project_tag_values ]
title = "The EC2 Instance project tag has an allowed value"
description = "Check if the EC2 Instance project tag has an allowed value."
sql = <> 'Project' as project_tag_value
from
data
where
tag_name = 'Project'
)
select
arn as resource,
case
when project_tag_values ? project_tag_value then 'ok'
else 'alarm'
end as status,
case
when project_tag_values ? project_tag_value then 'Project tag has allowed value'
else 'Project tag has wrong value'
end as reason,
project_tag_value
from
project_tags
EOQ
}
```
A DIY control is just a wrapper around a query that returns, minimally, the columns `resource`, `status`, and `reason`. You can then return one or more columns called dimensions. Here there's one, project_tag_value, which is the source of the value Cairo that you can see in the screenshot.
Here's a tip for writing your own controls: do them as tables first.
```
table "ec2_instance_project_tag" {
args = [ local.project_tag_values ]
sql = <