chart
Powerpipe is now the recommended way to run dashboards and benchmarks! Mods still work as normal in Steampipe for now, but they are deprecated and will be removed in a future release:
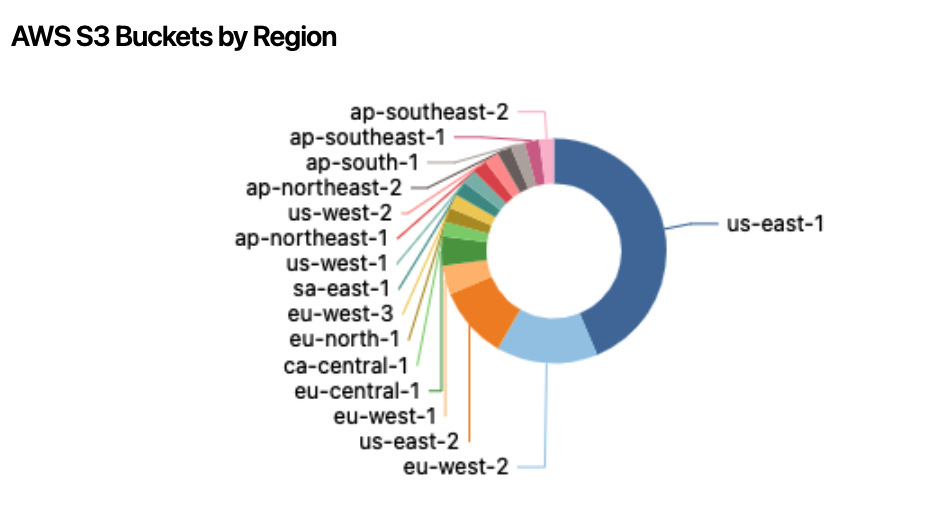
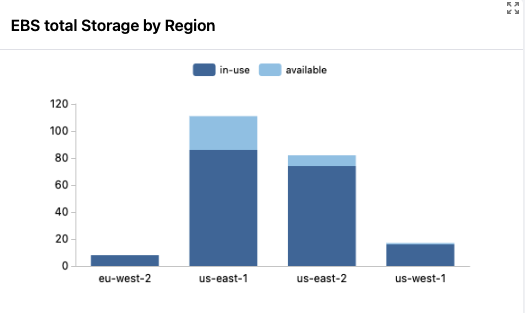
A chart enables visualisation of queries in a variety of charting types such as bar, column, donut, line or pie.
The chart types share key properties such as shape of the data and configuration. So, for example, if you change the type of chart from bar to line it just works.
Chart blocks can be declared as named resources at the top level of a mod, or be declared as anonymous blocks inside a dashboard or container, or be re-used inside a dashboard or container by using a chart with base = <mod>.chart.<chart_resource_name>.
Example Usage
Argument Reference
| Argument | Type | Optional? | Description |
|---|---|---|---|
args | Map | Optional | A map of arguments to pass to the query. |
axes | Block | Optional | See axes. |
base | Chart Reference | Optional | A reference to a named chart resource that this chart should source its definition from. title and width can be overridden after sourcing via base. |
grouping | Block | Optional | The layout for multi-series charts. Can be stack (the default) or compare. |
legend | Block | Optional | See legend. |
param | Block | Optional | A param block that defines the parameters that can be passed in to the query. param blocks may only be specified for charts that specify the sql argument. |
query | Query Reference | Optional | A reference to a query resource that defines the query to run. A chart may either specify the query argument or the sql argument, but not both. |
series | Block | Optional | A named block matching the name of the series you wish to configure. See series. |
sql | String | Optional | An SQL string to provide data for the chart. A chart may either specify the query argument or the sql argument, but not both. |
title | String | Optional | A plain text title to display for this chart. |
transform | String | Optional | See transform. |
type | String | Optional | The type of the chart. Can be bar, column, donut, line or pie. You can also use table to review the raw data. |
width | Number | Optional | The width as a number of grid units that this item should consume from its parent. |
Data Format
Data can be provided in 2 formats. Either in classic "Excel-like" column format, where each series data is contained in its own column:
| X-Axis | Y-Axis Series 1 | Y-Axis Series 2 | ... | Y-Axis Series N |
|---|---|---|---|---|
| Label 1 | Value 1 Series 1 | Value 1 Series 2 | ... | Value 1 Series N |
| Label 2 | Value 2 Series 1 | Value 2 Series 2 | ... | Value 2 Series N |
| ... | ... | ... | ... | ... |
| Label N | Value N Series 1 | Value 1 Series 2 | ... | Value N Series N |
Alternatively, data can be provided with the series data in rows.
| region | series_name | count |
|---|---|---|
| us-east-1 | foo | 4 |
| us-east-2 | bar | 1 |
| us-west-1 | foo | 1 |
| us-west-1 | bar | 2 |
The chart will automatically crosstab the data into the below format. See transform:
| region | foo | bar |
|---|---|---|
| us-east-1 | 4 | NULL |
| us-east-2 | NULL | 1 |
| us-west-1 | 1 | 2 |
Common Chart Properties
axes
Applicable to bar, column, line and scatter.
x
| Property | Type | Default | Values | Description |
|---|---|---|---|---|
title | See axis title | |||
labels | See labels |
y
| Property | Type | Default | Values | Description |
|---|---|---|---|---|
title | See axis title | |||
labels | See labels | |||
min | number | Determined by the range of values. For positive ranges, this will be 0. For negative ranges, this will be scaled to the next appropriate value below the range min. | Any valid number. | |
max | number | Determined by the range of values. For positive ranges, this will be scaled to the next appropriate value above the range max 0. For negative ranges, this will be 0. | Any valid number. |
axis title
| Property | Type | Default | Values | Description |
|---|---|---|---|---|
display | string | none | always or none (default). | always will ensure the axis title is always shown, or none will never show it. |
align | string | center | start, center (default) or end. | By default the chart will align the axis title in the center of the chart, but this can be overridden to start or end if required. |
value | string | Max 50 characters. |
transform
What data transform to apply.
Defaults to auto, which will automatically crosstab row series data into column series data if it detects a 3-column dataset, with the first 2 columns non-numeric and the 3rd column numeric.
Alternative values are none, which applies no data transforms, or crosstab which explicitly applies the crosstab transform that auto may apply.
labels
| Property | Type | Default | Values | Description |
|---|---|---|---|---|
display | string | auto | auto (default), always or none. | auto will display as many labels as possible for the size of the chart. always will always show all labels, but will truncate them with an ellipsis as necessary. none will never show labels for this axis. |
format | TBD |
legend
| Property | Type | Default | Values | Description |
|---|---|---|---|---|
display | string | auto | auto, all or none. | auto will display a legend if there are multiple data series. all will ensure a legend is always shown, or none will never show a legend. |
position | string | top | top, right, bottom or left. | By default the chart will display a legend at the top of the chart, but this can be overridden to right, bottom or left if required. |
series
| Property | Type | Default | Values | Description |
|---|---|---|---|---|
title | string | The column name that the series data resides in. | Max 50 characters | |
color | string | The matching color from the default theme for the data series index. | A valid color value. This may be a named color, RGB or RGBA string, or a control status color. | |
point | string | An element of a series. | A point. |
point
| Property | Type | Default | Values | Description |
|---|---|---|---|---|
color | string | The matching color from the default theme for the data series index. | A valid color value. This may be a named color, RGB or RGBA string, or a control status color. |
More Examples
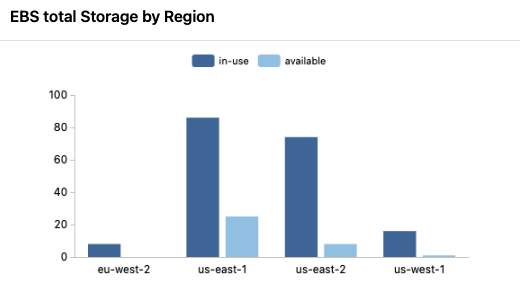
Multi-series bar chart with custom properties
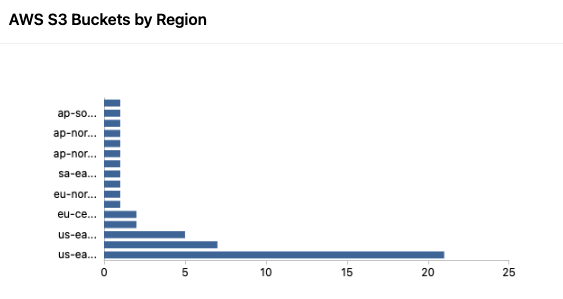
Bar Chart
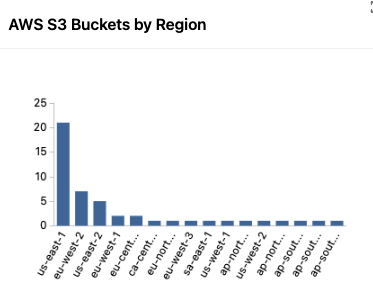
Column Chart
Donut Chart
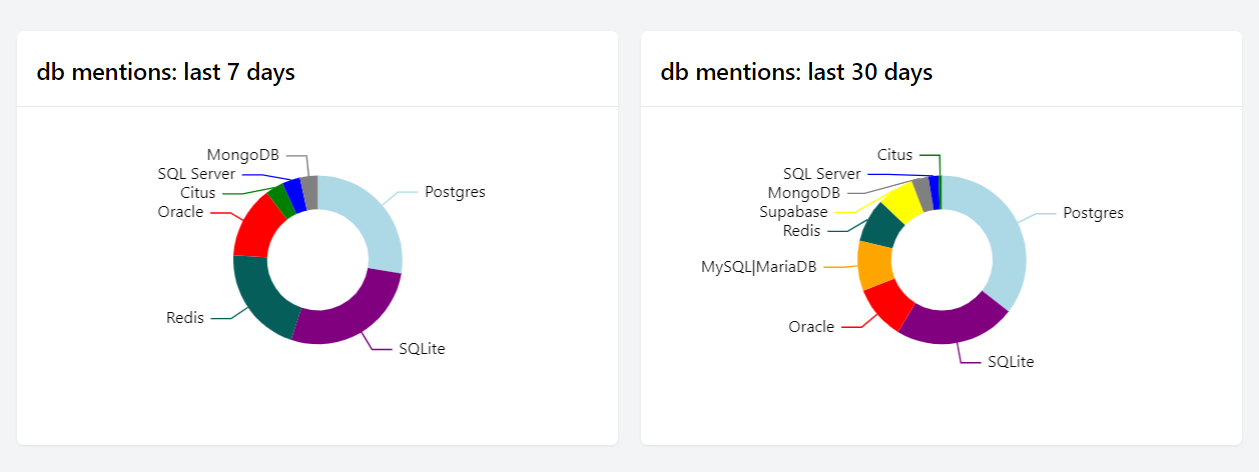
Multiple donut charts
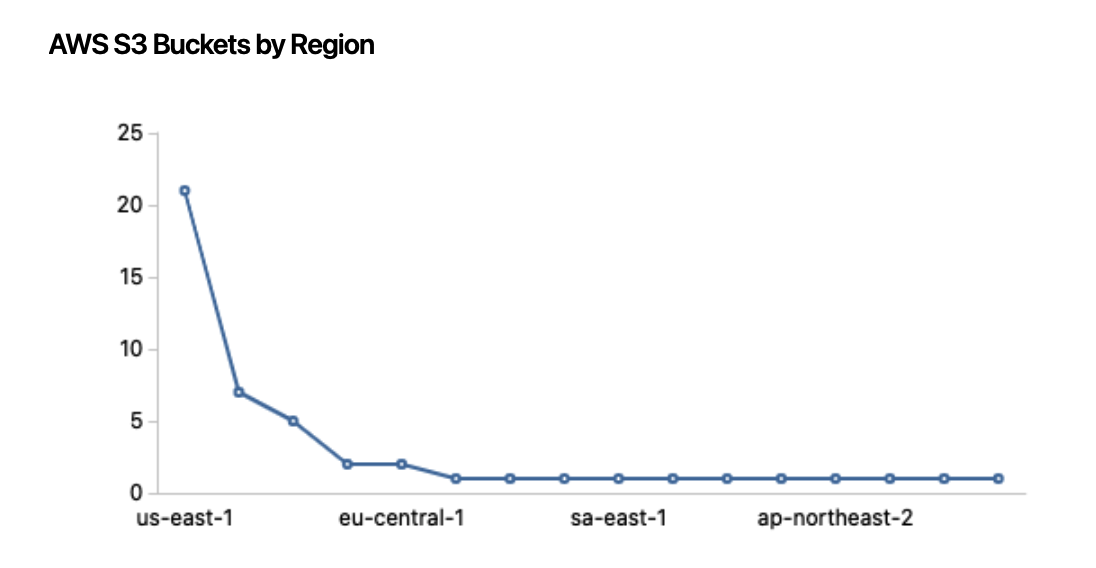
Line Chart
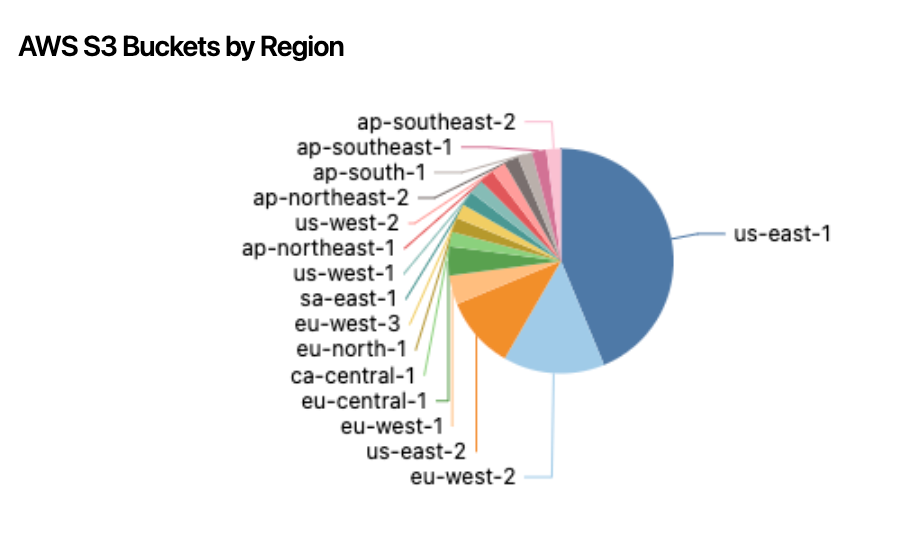
Pie Chart
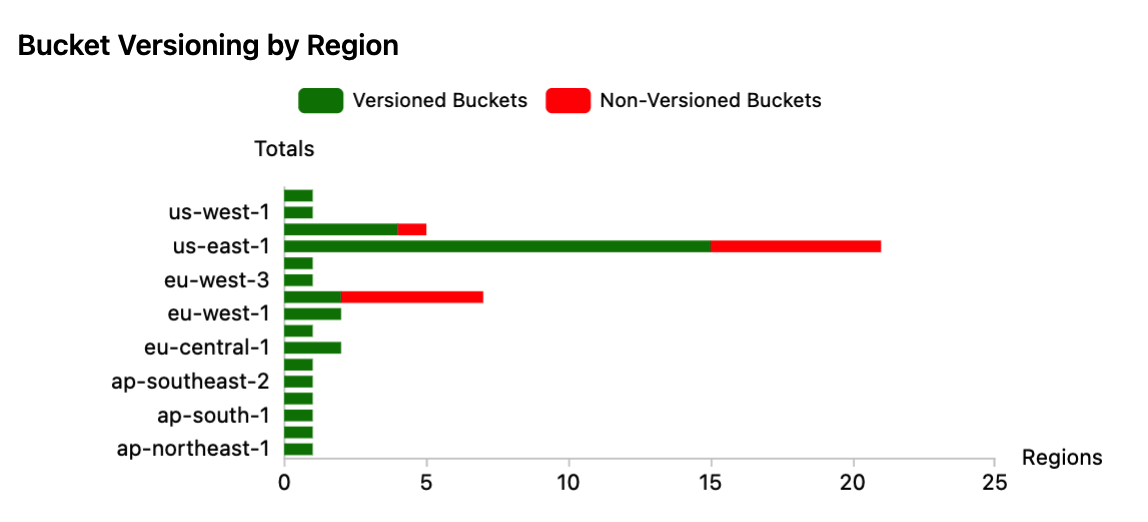
Stack Chart
Comparison Chart