
graph
Powerpipe is now the recommended way to run dashboards and benchmarks! Mods still work as normal in Steampipe for now, but they are deprecated and will be removed in a future release:
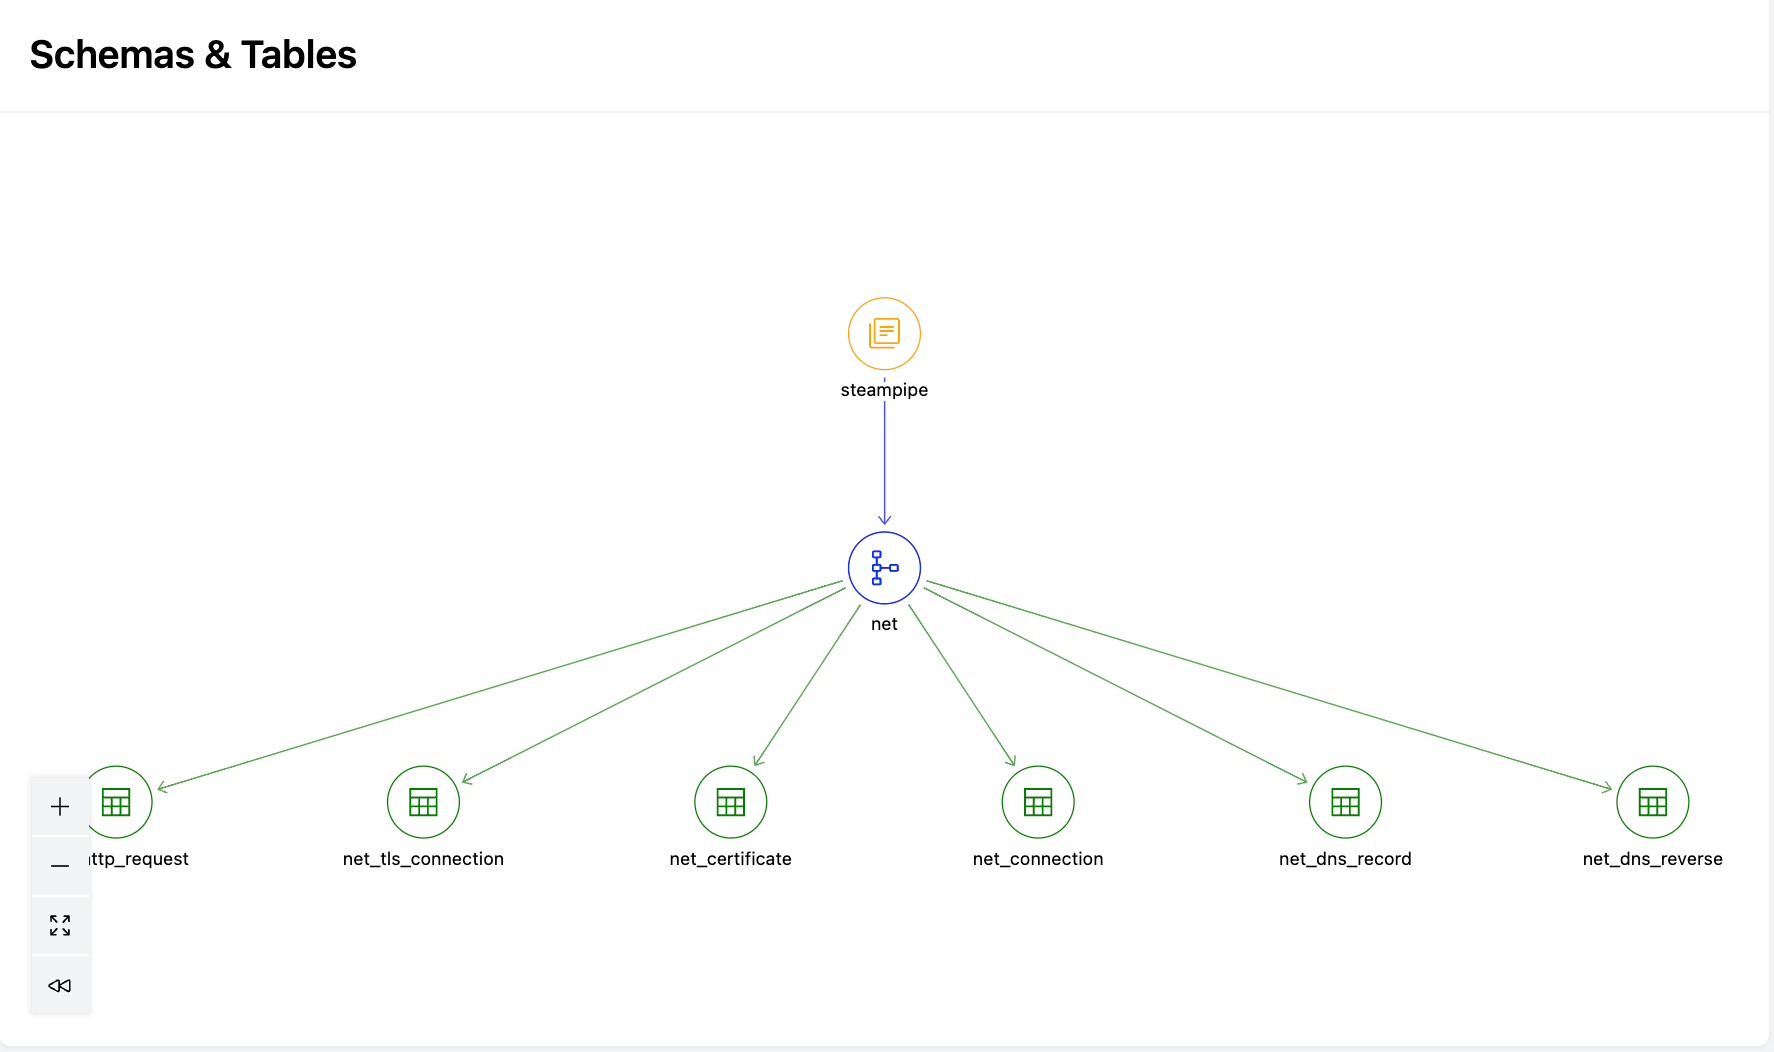
A graph is a dashboard component that allows you to visualize the relationships between different resources and understand how they are connected.
Graphs can be declared as a block inside a dashboard or container. The data to be displayed in the graph is specified using a series of nodes and edges. The nodes define the vertices of the graph, and the edges define the connections between them.
Example Usage
Argument Reference
| Argument | Type | Optional? | Description |
|---|---|---|---|
args | Map | Optional | A map of arguments to pass to the query. |
base | Graph Reference | Optional | A reference to a named graph resource that this graph should source its definition from. |
category | Block | Optional | category blocks that specify display options for nodes and edges with that category. |
direction | String | Optional | The direction of the graph layout. Valid options are left_right and top_down. The default is top_down. |
edge | Block | Optional | edge blocks that define the edges in the graph. |
node | Block | Optional | node blocks that define the nodes in the graph. |
param | Block | Optional | A param block that defines the parameters that can be passed in to the graph. You can only specify param blocks when the graph is defined as a top-level, named resource. |
query | Query Reference | Optional | A reference to a query resource that defines the query to run. A graph may either specify the query argument or the sql argument, but not both. |
sql | String | Optional | A SQL string to provide data for the graph. A graph may either specify the query argument or the sql argument, but not both. |
title | String | Optional | The title to display above the graph. |
type | String | Optional | The type of graph to display. Currently, only graph is supported. The default is graph. |
width | Number | Optional | The width as a number of grid units that this item should consume from its parent. |
with | Block | Optional | with blocks that define prerequisite queries to run. with blocks may only be specified when the graph is defined as a top-level (mod level), named resource. |
Node/Edge Visualizations
Some steampipe dashboard elements can include node and edge blocks. These elements are sometimes referred to as node/edge visualizations and include graph, flow, and hierarchy. These resources essentially implement the same interface:
- They support
nodeandedgeblocks as children - They are also query-based resources, and support using the
sqlandqueryarguments instead ofnodeandedgeblocks - They must appear in a dashboard to be displayed, but may be defined as top level resources and referenced with
base - They support
paramandwithblocks, but only when in a top level resource - They support
categoryblocks - They have similar data formats
Monolithic Query v/s Node & Edge Blocks
Node/edge visualizations allow you to specify a monolithic query that returns a row for each node and edge, or you can specify node and edge blocks to define the nodes and edges separately.
In either case, the concept of nodes and edges is the same. Nodes and edges represent points and connections in a graph, hierarchy or flow. A node is a vertex in the diagram, whereas as an edge is a relationship between 2 nodes (usually represented with a line connecting them).
Key differences between nodes and edges are:
- A
nodeMUST have anid. AnedgeCANNOT have anid. - An
edgemust have afrom_idand ato_id. AnodeCANNOT have ato_id. Nodes USUALLY do not have afrom_ideither, however for simple single-parent hierarchies it is often simpler to create a simple edge by specifyingfrom_idon thenodeinstead of creating separate node and edge blocks / rows.
Node & Edge Blocks
Typically, it is preferable to specify node and edge blocks than to use the monolithic query format:
- Using
nodeandedgeresults in simpler, more readable, maintainable configuration. - Developing large union queries is difficult. Errors are hard to find and fix. The
nodeandedgemodel provides smaller, simpler queries that can be run and tested independently. - You can reuse nodes and edges in multiple node/edge visualizations.
- Steampipe can run the node/edge queries in parallel, and can provide better status information while the visualization is loading.
In the node / edge model, your graph, flow, or hierarchy block will not specify the sql or query argument, but instead will contain one or more node blocks and edge blocks. The node and edge blocks will specify the sql or query argument to retrieve the data for the node or edge.
The sql column names are identical to the monolithic query format. Note that some fields (category, title) may be specified in HCL or in the query results. When both are specified, the SQL value takes precedence.
Example: Graph with node/edge blocks
Including the full node and edge block definitions within the graph can become unwieldy as the graph becomes more complex. It is often preferable to define the node and edge blocks as top-level resources and include them in the graph with the base argument. This allows you to reuse the nodes and edges in multiple node/edge visualizations. You can even define parameters in the nodes and edges, and pass arguments from the graph.
Monolithic query
Node/edge visualizations are also query-based resources, and support using either the sql or query argument (but not both). When using a monolithic query, the query must return a row for each node and edge. Note that using a single query is an older format - generally it is simpler to use node and edge blocks instead.
Significant columns are:
| Name | Applies To | Description |
|---|---|---|
id | node | A unique identifier for the node. Nodes have an id, edges do not. id is required for nodes. |
title | node, edge | A title to display for the node. |
category | node, edge | A display category. This can be a category block or a reference to a named category. |
depth | node (flow only) | An integer to set the position of the node in a flow. The layout of the nodes is inferred from the query, however you can force placement with the depth column if you need to override the default behavior. |
from_id | node, edge | The id of the source side of an edge. from_id is required for edges, optional for nodes. |
properties | node, edge (graph only) | A jsonb key/value map of properties to display for the node/edge when the user hovers over it. The properties column is optional for nodes and edges. |
to_id | edge | The id of the destination side of an edge. to_id is required for edges. |
Typically, the monolithic query will be a large union query. Note that both column names and their relative position are important! Steampipe looks for columns by name in the result set, however Postgres union queries will append the rows based on the column's position, not the name of the column. All the union queries must return the same columns, in the same order.
Most commonly, you should specify nodes and edges as separate rows. In this case, nodes will have an id and optionally title, category, and/or depth, but to_id and from_id will be null. Edges will populate to_id and from_id and optionally category, and will have null id, depth, and title:
| from_id | to_id | id | title | category |
|---|---|---|---|---|
| <null> | <null> | 1 | foo | root |
| <null> | <null> | 2 | bar | widget |
| <null> | <null> | 3 | baz | widget |
| <null> | <null> | 4 | foobar | fidget |
| 1 | 2 | <null> | <null> | widget |
| 1 | 3 | <null> | <null> | widget |
| 2 | 4 | <null> | <null> | fidget |
| 3 | 4 | <null> | <null> | fidget |
If the data is strictly hierarchical (where each node can only have a single parent, as for a hierarchy), it may be simpler to format the results such that each row species a node (with an id, and optionally title, category, and/or depth) and an edge, by specifying a from_id:
| from_id | id | title | category |
|---|---|---|---|
| <null> | 1 | foo | root |
| 1 | 2 | bar | widget |
| 1 | 3 | baz | widget |
| 2 | 4 | foobar | fidget |
Example: Graph with monolithic query
Categories
Node/Edge visualizations allow you to specify a category for each node and edge. Categories are used to define display properties such as color, title, and icon to provide a consistent look and feel across panels and dashboards.
Categories may be defined either at the mod level or in a graph, flow, or hierarchy. When using node and edge blocks, it is typically preferable to define the categories as top-level, named mod resources. This allows you to reference them via the category HCL argument in a node or edge. When specifying a category column in SQL, such as when using the monolithic query approach, you will need to define the category in the graph, flow, or hierarchy.
With blocks
Node/Edge visualizations support with blocks. Similar to a with clause in a postgres CTE, the with block allows you to specify additional queries or SQL statements to run first, and then pass the query results as arguments to sql, query, and node & edge blocks.
You can only specify with blocks on top-level named resources in your mod. The results of the with query can be referenced only within the resource in which it is defined (including any sub-blocks).